
To celebrate the end of finals, here's some fantasy advice.
QB:
Start 'em
1. Payton Manning, IND
2. Donovan McNabb, PHI
3. Kurt Warner, ARI
4. Philip Rivers, SD
5. Chad Pennington, MIA
Sit 'em
1. Ben Roethlisberger, PIT
2. Derek Anderson, CLE
3. Carson Palmer, CIN
4. Joe Flacco, BAL
5. Matt Hasselbeck, SEA
RB:
Start 'em
1. Michael Turner, ATL
2. DeAngelo Williams, CAR
3. Chris Johnson, TEN
4. Clinton Portis, WAS
5. Thomas Jones, NYJ
Sit 'em
1. Frank Gore, SF
2. Edgerrin James, ARI
3. Kevin Smith, DET
4. Pierre Thomas, NO
5. Jamal Lewis, CLE
Defense:
Start 'em
1. MIA
2. PHI
3. WAS
4. IND
5. ATL
Sit 'em
1. DET
2. CLE
3. DEN
4. SF
5. BUF
Showing posts with label 2008 NFL Season. Show all posts
Showing posts with label 2008 NFL Season. Show all posts
Saturday, December 13, 2008


Monday, November 17, 2008
NFLSim Stats vs. Actual NFL Stats
I'm sure everyone's curious to see how NFLSim actually compares to real life. These are the overall results so far. First, I'll post the comparison of NFLSim averages to NFL averages. Later, I'll post a team-by-team comparison to see how well it works on a smaller scale. I'm only going to focus on the main stats: passing, rushing, and game stats. I'll put up my average alongside the real stats. When you average the stats from all of the teams, the total offensive averages are the same as the defensive averages.
Many stats are very close to reality, some aren't as close. I know many of you out there are interested in sports statistics and many are interested in fantasy football, so this is for you guys. NFLSim is good, but it's not perfect. This is an opportunity for everyone to get a better understanding of what it does as well as for myself to make improvements.
I encourage everyone to email other NFL simulators to find out how they're doing, then post that over here for a comparison. If you're going to be following their models, you should know how those models actually perform.
These numbers tell me that for the most part, everything is going very well. Some changes I need to make include: more passes, decrease the average rush yards, decrease fumble %, and adjust 3rd down play selection. No major changes, just little tweaks. Otherwise, things are going swimmingly. Send me some feedback, I'd like to hear what everyone thinks.
Many stats are very close to reality, some aren't as close. I know many of you out there are interested in sports statistics and many are interested in fantasy football, so this is for you guys. NFLSim is good, but it's not perfect. This is an opportunity for everyone to get a better understanding of what it does as well as for myself to make improvements.
I encourage everyone to email other NFL simulators to find out how they're doing, then post that over here for a comparison. If you're going to be following their models, you should know how those models actually perform.
These numbers tell me that for the most part, everything is going very well. Some changes I need to make include: more passes, decrease the average rush yards, decrease fumble %, and adjust 3rd down play selection. No major changes, just little tweaks. Otherwise, things are going swimmingly. Send me some feedback, I'd like to hear what everyone thinks.
| PASSING | ||
| ATT/GAME | NFLSim | NFL |
| Average | 27.2 | 32.4 |
| COMP/G | ||
| Average | 17.0 | 19.8 |
| COMP % | ||
| Average | 62.3% | 61.3% |
| YDS/G | ||
| Average | 192.2 | 212.9 |
| YDS/PASS | ||
| Average | 7.06 | 6.97 |
| PASS TD/G | ||
| Average | 1.60 | 1.30 |
| INT/G | ||
| Average | 0.79 | 0.90 |
| SACK/G | ||
| Average | 2.1 | 2.1 |
| QB RATING | ||
| Average | 91.0 | 83.6 |
| RUSHING | ||
| ATT/GAME | NFLSim | NFL |
| Average | 27.6 | 27.3 |
| YDS/G | ||
| Average | 118.4 | 112.3 |
| YDS/RUSH | ||
| Average | 4.3 | 4.1 |
| RUSH TD/G | ||
| Average | 1.2 | 0.9 |
| FUM/G | ||
| Average | 0.6 | 0.4 |
| GAME STATS | ||
| PTS/G | NFLSim | NFL |
| Average | 22.9 | 22.2 |
| PLAYS/G | ||
| Average | 60.3 | 61.8 |
| TOTAL YDS/G | ||
| Average | 310.6 | 325.2 |
| YDS/PLAY | ||
| Average | 5.2 | 5.3 |
| 3rd DN % | ||
| Average | 25.8% | 39.4% |
| YDS/PT | ||
| Average | 13.6 | 14.9 |
Wednesday, November 5, 2008
Midseason Progressive Results
And now, what everyone's been waiting for. We're about halfway through the season, so I think it's time to post NFLSim's impressive progressive results. I chose to leave out week 2 because It was still too early for me to be making predictions based on 1 week of data. I'm going to post Accuscore's results as well for a comparison. They're the only other play-by-play NFL simulator I know of and they're a well established, well funded, syndicated, sponsored, and mathematically sophisticated operation. David and Goliath? Let's see...
I'm going to give you several different numbers. First, I'll give you the overall numbers, as in the collective 50-100% predictions for winner, spread, and o/u. Then you'll get their numbers broken down. I'll show you weekly trends, % trends, etc.
Overall numbers:
Winner: 65-34 (65.7%)
Spread: 47-45 (51.5%)
O/U: 50-43 (53.8%)
Spread and O/U combined: 97-88 (53.8%)
Accuscore numbers:
Winner: 87-43 (66.9%)
Spread: 51-50 (50.5%)
O/U: 67-50 (57.2%)
Spread and O/U combined: 118-100 (54.1%)
Accuscore has a slight edge when picking the winner, I have a slight edge picking ATS, and Accuscore has a sizeable advantage picking O/U. BUT! Let's look at how Black Box Sports picks compare when confidence is at least 60%. This confidence is really where NFLSim shines. Here is Black Box Sports's record when the confidence is over 60% compared to Accuscore's overall record (can't find any confidence values for picks). Fasten your seat belts.
Black Box Sports +60%:
Winner: 41-19 (68.3%) ... 22-8 (73.3%) when greater than 70%
Spread: 36-21 (63.2%)
O/U: 21-10 (67.7%)
Spread and O/U: 57-31 (64.7%)
Betting 100 units on the spread and over/under, you made +2290, ROI of 26%, halfway through the season.
Once again, Accuscore's numbers:
Accuscore:
Winner: 87-43 (66.9%)
Spread: 51-50 (50.5%)
O/U: 67-50 (57.2%)
Spread and O/U combined: 118-100 (54.1%)
Picking the winner, I'm ahead by 1.4% when at least 60% confidence, 6.4% when at least 70% confidence. Spread, I'm ahead by 12.7%. O/U, up by 10.5%. Combined, I'm up by 10.6%. That's what I'm talking about. Not to mention I offer all the picks for free... Spread the word everyone.
In tabular format:
Graphically:
Theoretically, as in, if NFLSim was a perfect analog of reality, those dashed lines would be perfectly in line with the thick black line. It would mean that the confidence values are always spot on and the games end exactly the way they should. If the trend (dashed) lines are below the thick line, the confidence values are not as accurate as reality. The more parallel the thick and trend lines are, the more accurate the changes in confidenc values are, i.e., as confidence increases, the accuracy increases at the correct rate. If that makes any sense. This graph shows all the picks.
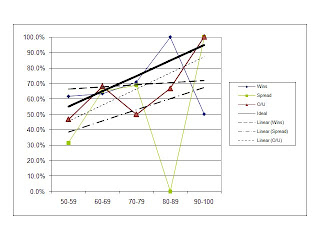
You'll notice that above, the win % for 90-100 is at 50%. In week 3, the 90.03% favorite NE lost to MIA. 0.03% is just about a difference of 1 game in the entire set of hundreds and hundreds of simulated games. Had NE been an 89.97% favorite, the graph would look like this:
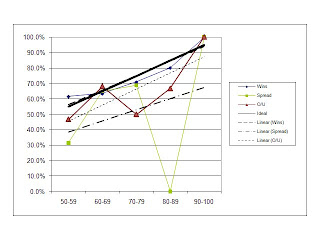
Check out the 'Wins' line. The Wins line overlaps the theoretical line. You can't even see it. That's absolutely absurd, especially after 100 games. The trendline has a slope of .09, compared to the theoretical line's .1. The "Wins" trendline has an R-squared value (a measure of how closely the data points fit the line) of 0.89. Absolutely insane. In general, I try to temper my enthusiasm, but this is unbelievable... This means that when NFLSim says a team will win 63% of the time, that team will win 63% of the time. For those of you math-minded people, the expected number of wins is approximately 64.15. The actual number of wins is 65. That blows my mind.
Here's a team-by-team accuracy breakdown:
I'll post some more stats if I have a chance.
Enjoy!
I'd love to hear everyone's reactions and questions, so don't be shy, send me some emails.
I'm going to give you several different numbers. First, I'll give you the overall numbers, as in the collective 50-100% predictions for winner, spread, and o/u. Then you'll get their numbers broken down. I'll show you weekly trends, % trends, etc.
Overall numbers:
Winner: 65-34 (65.7%)
Spread: 47-45 (51.5%)
O/U: 50-43 (53.8%)
Spread and O/U combined: 97-88 (53.8%)
Accuscore numbers:
Winner: 87-43 (66.9%)
Spread: 51-50 (50.5%)
O/U: 67-50 (57.2%)
Spread and O/U combined: 118-100 (54.1%)
Accuscore has a slight edge when picking the winner, I have a slight edge picking ATS, and Accuscore has a sizeable advantage picking O/U. BUT! Let's look at how Black Box Sports picks compare when confidence is at least 60%. This confidence is really where NFLSim shines. Here is Black Box Sports's record when the confidence is over 60% compared to Accuscore's overall record (can't find any confidence values for picks). Fasten your seat belts.
Black Box Sports +60%:
Winner: 41-19 (68.3%) ... 22-8 (73.3%) when greater than 70%
Spread: 36-21 (63.2%)
O/U: 21-10 (67.7%)
Spread and O/U: 57-31 (64.7%)
Betting 100 units on the spread and over/under, you made +2290, ROI of 26%, halfway through the season.
Once again, Accuscore's numbers:
Accuscore:
Winner: 87-43 (66.9%)
Spread: 51-50 (50.5%)
O/U: 67-50 (57.2%)
Spread and O/U combined: 118-100 (54.1%)
Picking the winner, I'm ahead by 1.4% when at least 60% confidence, 6.4% when at least 70% confidence. Spread, I'm ahead by 12.7%. O/U, up by 10.5%. Combined, I'm up by 10.6%. That's what I'm talking about. Not to mention I offer all the picks for free... Spread the word everyone.
In tabular format:
| Winner | Wins | Games | Win % | |
| 50-59 | 24 | 39 | 61.5% | |
| 60-69 | 19 | 30 | 63.3% | |
| 70-79 | 17 | 24 | 70.8% | |
| 80-89 | 4 | 4 | 100.0% | |
| 90-100 | 1 | 2 | 50.0% | |
| Total | 65 | 99 | 65.7% | |
| Spread | Wins | Games | Win % | |
| 50-59 | 11 | 35 | 31.4% | |
| 60-69 | 24 | 37 | 64.9% | |
| 70-79 | 11 | 16 | 68.8% | |
| 80-89 | 0 | 3 | 0.0% | |
| 90-100 | 1 | 1 | 100.0% | |
| Total | 47 | 92 | 51.1% | |
| Over | Wins | Games | Win % | |
| 50-59 | 29 | 62 | 46.8% | |
| 60-69 | 15 | 22 | 68.2% | |
| 70-79 | 2 | 4 | 50.0% | |
| 80-89 | 2 | 3 | 66.7% | |
| 90-100 | 2 | 2 | 100.0% | |
| Total | 50 | 93 | 53.8% |
S&O/U | ||||
| 50-59 | 40 | 97 | 41.2% | |
| 60-69 | 39 | 59 | 66.1% | |
| 70-79 | 13 | 20 | 65.0% | |
| 80-89 | 2 | 6 | 33.3% | |
| 90-100 | 3 | 3 | 100.0% | |
| Total | 97 | 185 | 52.4% |
Graphically:
Theoretically, as in, if NFLSim was a perfect analog of reality, those dashed lines would be perfectly in line with the thick black line. It would mean that the confidence values are always spot on and the games end exactly the way they should. If the trend (dashed) lines are below the thick line, the confidence values are not as accurate as reality. The more parallel the thick and trend lines are, the more accurate the changes in confidenc values are, i.e., as confidence increases, the accuracy increases at the correct rate. If that makes any sense. This graph shows all the picks.

You'll notice that above, the win % for 90-100 is at 50%. In week 3, the 90.03% favorite NE lost to MIA. 0.03% is just about a difference of 1 game in the entire set of hundreds and hundreds of simulated games. Had NE been an 89.97% favorite, the graph would look like this:

Check out the 'Wins' line. The Wins line overlaps the theoretical line. You can't even see it. That's absolutely absurd, especially after 100 games. The trendline has a slope of .09, compared to the theoretical line's .1. The "Wins" trendline has an R-squared value (a measure of how closely the data points fit the line) of 0.89. Absolutely insane. In general, I try to temper my enthusiasm, but this is unbelievable... This means that when NFLSim says a team will win 63% of the time, that team will win 63% of the time. For those of you math-minded people, the expected number of wins is approximately 64.15. The actual number of wins is 65. That blows my mind.
Here's a team-by-team accuracy breakdown:
| Win % | Cover Spread % | Over % | |
| ARI | 83.3% | 40.0% | 50.0% |
| ATL | 66.7% | 50.0% | 33.3% |
| BAL | 57.1% | 42.9% | 71.4% |
| BUF | 66.7% | 50.0% | 66.7% |
| CAR | 83.3% | 40.0% | 50.0% |
| CHI | 50.0% | 50.0% | 66.7% |
| CIN | 71.4% | 71.4% | 33.3% |
| CLE | 42.9% | 42.9% | 57.1% |
| DAL | 57.1% | 57.1% | 57.1% |
| DEN | 50.0% | 33.3% | 20.0% |
| DET | 100.0% | 66.7% | 40.0% |
| GB | 100.0% | 66.7% | 66.7% |
| HOU | 71.4% | 57.1% | 85.7% |
| IND | 33.3% | 50.0% | 33.3% |
| JAX | 33.3% | 66.7% | 60.0% |
| KC | 83.3% | 66.7% | 83.3% |
| MIA | 33.3% | 66.7% | 50.0% |
| MIN | 83.3% | 66.7% | 50.0% |
| NE | 33.3% | 20.0% | 20.0% |
| NO | 66.7% | 33.3% | 50.0% |
| NYG | 66.7% | 16.7% | 20.0% |
| NYJ | 71.4% | 57.1% | 57.1% |
| OAK | 57.1% | 14.3% | 57.1% |
| PHI | 66.7% | 0.0% | 66.7% |
| PIT | 50.0% | 66.7% | 66.7% |
| SD | 83.3% | 50.0% | 33.3% |
| SEA | 83.3% | 50.0% | 33.3% |
| SF | 50.0% | 33.3% | 40.0% |
| STL | 57.1% | 50.0% | 28.6% |
| TB | 71.4% | 42.9% | 57.1% |
| TEN | 100.0% | 66.7% | 83.3% |
| WAS | 42.9% | 28.6% | 33.3% |
I'll post some more stats if I have a chance.
Enjoy!
I'd love to hear everyone's reactions and questions, so don't be shy, send me some emails.
Saturday, September 13, 2008
Week 2 Simulated Stats
I got a request to post yards/pass, yards/play, and yards/point, so here they are. Again, remember that it's early in the season, so there isn't very much information for NFLSim to use. At this point in the season it may be better to use the stats for comparisons rather than to use them as definite predictions. I apologize for the (lack of) formatting of the data tables, if anyone knows how to insert tables from Excel, I'd appreciate some help. I already tried copy and paste. The tables won't be pretty this week, hopefully I'll figure it out for next week.
TEAM YDS/PASS YDS/PLAY YDS/POINT
ARI 8.57 6.00 12.46
ATL 11.25 7.85 12.05
BAL 6.35 5.68 13.01
BUF 7.58 5.74 13.34
CAR 6.17 5.30 11.48
CHI 7.81 5.86 15.83
CIN 5.70 4.57 14.54
CLE 6.59 5.80 16.13
DAL 8.46 6.24 14.48
DEN 8.74 6.95 11.95
DET 6.91 5.66 9.64
GB 10.36 8.26 16.35
HOU 5.95 5.10 13.10
IND 7.18 5.65 13.70
JAX 5.64 4.27 8.48
KC 9.19 6.66 10.71
MIA 7.04 5.26 12.40
MIN 6.40 6.11 13.20
NE 6.75 5.08 12.01
NO 7.86 5.99 12.84
NYG 8.00 6.01 12.37
NYJ 8.38 6.22 12.86
OAK 7.50 6.24 19.02
PHI 7.53 6.02 12.08
PIT 8.30 5.98 10.17
SD 7.54 5.90 14.65
SF 8.34 5.87 12.10
SEA 6.06 4.90 13.90
STL 6.21 5.29 13.59
TB 7.59 6.47 14.01
TEN 6.35 5.48 10.91
WAS 5.61 6.04 14.27
TEAM YDS/PASS YDS/PLAY YDS/POINT
ARI 8.57 6.00 12.46
ATL 11.25 7.85 12.05
BAL 6.35 5.68 13.01
BUF 7.58 5.74 13.34
CAR 6.17 5.30 11.48
CHI 7.81 5.86 15.83
CIN 5.70 4.57 14.54
CLE 6.59 5.80 16.13
DAL 8.46 6.24 14.48
DEN 8.74 6.95 11.95
DET 6.91 5.66 9.64
GB 10.36 8.26 16.35
HOU 5.95 5.10 13.10
IND 7.18 5.65 13.70
JAX 5.64 4.27 8.48
KC 9.19 6.66 10.71
MIA 7.04 5.26 12.40
MIN 6.40 6.11 13.20
NE 6.75 5.08 12.01
NO 7.86 5.99 12.84
NYG 8.00 6.01 12.37
NYJ 8.38 6.22 12.86
OAK 7.50 6.24 19.02
PHI 7.53 6.02 12.08
PIT 8.30 5.98 10.17
SD 7.54 5.90 14.65
SF 8.34 5.87 12.10
SEA 6.06 4.90 13.90
STL 6.21 5.29 13.59
TB 7.59 6.47 14.01
TEN 6.35 5.48 10.91
WAS 5.61 6.04 14.27
Friday, September 12, 2008
Week 2 Predictions
I'm going to withhold the total predictions for this week, but I'll put up the winners and spreads. This week's predictions are going to sound ridiculous. I was actually thinking about waiting another week before putting them up, but I went back and looked at the simulation of last season's week 2 to see how they compared. In both weeks 2 there were many picks of huge underdogs, but that week actually turned out to be a very good one. I won't give out that week's exact numbers because I don't want heightened expectations. Remember, use these at your own risk. If you're in a suicide / survivor pool and you see that SF wins 79% when they're a 7 point dog, use some discretion. Bear in mind it's the beginning of the season, so the picks may not be as reliable because of a lack of data. That said, here we go...
If the confidence is 50%, I'll just write EVEN.
NYG -8.5 at STL
Winner: NYG, 76%
Spread: EVEN
IND -2 at MIN
Winner: MIN, 54%
Spread: MIN +2, 58%
NO -1 at WAS
Winner: NO, 61%
Spread: NO -1, 60%
CHI at CAR -3
Winner: CAR, 51%
Spread: CHI +3, 61%
BUF at JAX -5
Winner: BUF, 64%
Spread: BUF +5, 77%
TEN at CIN -1
Winner: TEN, 79%
Spread: TEN +1, 80%
GB -3.5 at DET
Winner: DET, 59%
Spread: DET +3.5, 64%
OAK at KC -3.5
Winner: KC, 81%
Spread: KC -3.5, 72%
SF at SEA -6.5
Winner: SF, 79%
Spread: SF +6.5, 89%
ATL at TB -7
Winner: ATL, 80%
Spread: ATL +7, 92%
SD -1 at DEN
Winner: DEN, 74%
Spread: DEN +1, 75%
BAL at HOU -4.5
Winner: BAL, 70%
Spread: BAL +4.5, 80%
NE at NYJ -1.5
Winner: NYJ, 53%
Spread: EVEN
MIA at ARI -6.5
Winner: ARI, 57%
Spread: MIA +6.5, 61%
PIT -6 at CLE
Winner: PIT, 91%
Spread: PIT -6, 79%
PHI at DAL -7
Winner: PHI, 65%
Spread: PHI +7, 84%
If the confidence is 50%, I'll just write EVEN.
NYG -8.5 at STL
Winner: NYG, 76%
Spread: EVEN
IND -2 at MIN
Winner: MIN, 54%
Spread: MIN +2, 58%
NO -1 at WAS
Winner: NO, 61%
Spread: NO -1, 60%
CHI at CAR -3
Winner: CAR, 51%
Spread: CHI +3, 61%
BUF at JAX -5
Winner: BUF, 64%
Spread: BUF +5, 77%
TEN at CIN -1
Winner: TEN, 79%
Spread: TEN +1, 80%
GB -3.5 at DET
Winner: DET, 59%
Spread: DET +3.5, 64%
OAK at KC -3.5
Winner: KC, 81%
Spread: KC -3.5, 72%
SF at SEA -6.5
Winner: SF, 79%
Spread: SF +6.5, 89%
ATL at TB -7
Winner: ATL, 80%
Spread: ATL +7, 92%
SD -1 at DEN
Winner: DEN, 74%
Spread: DEN +1, 75%
BAL at HOU -4.5
Winner: BAL, 70%
Spread: BAL +4.5, 80%
NE at NYJ -1.5
Winner: NYJ, 53%
Spread: EVEN
MIA at ARI -6.5
Winner: ARI, 57%
Spread: MIA +6.5, 61%
PIT -6 at CLE
Winner: PIT, 91%
Spread: PIT -6, 79%
PHI at DAL -7
Winner: PHI, 65%
Spread: PHI +7, 84%
Monday, September 1, 2008
Just a Reminder...
Just a reminder, everyone: The predictions begin week 2, that's Sunday, Sept. 14. Since I need numbers to use in the simulation, I can't simulate week 1. I hate the wait but I'd rather hold off a week than B.S. some results and risk getting off to a bad start.
So keep coming back to NFL Black Box, I'll be posting a new article soon. If anyone has a question they'd like answered, send it in. Else, I'll think of something interesting to write about.
Jonathan
Black Box Sports
P.S. Sweet new logo, right?
So keep coming back to NFL Black Box, I'll be posting a new article soon. If anyone has a question they'd like answered, send it in. Else, I'll think of something interesting to write about.
Jonathan
Black Box Sports
P.S. Sweet new logo, right?
Tuesday, August 5, 2008
Welcome Back
Hey guys,
Football season's right around the corner, finally. It's almost time to have some fun with these predictions. Officially, the first week I'll simulate is week 2 (Sept. 14). I need data for the simulation and unfortunately preseason numbers don't work. Although, if anyone's curious, I suppose I can run a few sim's for sh!ts 'n giggles.
Write a comment with your fantasy matchup; specify the home team (or neutral) and let me know if you want me to use numbers from the end of the '07 season or preseason.
More updates will follow as the 2008 NFL season approaches.
p.s. I got a shiny new laptop that runs the program 4x as fast as my old crappy laptop (craptop). This means that I can run even more simulations for each game, making the predictions even more accurate!
Football season's right around the corner, finally. It's almost time to have some fun with these predictions. Officially, the first week I'll simulate is week 2 (Sept. 14). I need data for the simulation and unfortunately preseason numbers don't work. Although, if anyone's curious, I suppose I can run a few sim's for sh!ts 'n giggles.
Write a comment with your fantasy matchup; specify the home team (or neutral) and let me know if you want me to use numbers from the end of the '07 season or preseason.
More updates will follow as the 2008 NFL season approaches.
p.s. I got a shiny new laptop that runs the program 4x as fast as my old crappy laptop (craptop). This means that I can run even more simulations for each game, making the predictions even more accurate!
Subscribe to:
Posts (Atom)

