Showing posts with label Sports Simulation. Show all posts

Monday, November 17, 2008

NFLSim Stats vs. Actual NFL Stats

I'm sure everyone's curious to see how NFLSim actually compares to real life. These are the overall results so far. First, I'll post the comparison of NFLSim averages to NFL averages. Later, I'll post a team-by-team comparison to see how well it works on a smaller scale. I'm only going to focus on the main stats: passing, rushing, and game stats. I'll put up my average alongside the real stats. When you average the stats from all of the teams, the total offensive averages are the same as the defensive averages.

Many stats are very close to reality, some aren't as close. I know many of you out there are interested in sports statistics and many are interested in fantasy football, so this is for you guys. NFLSim is good, but it's not perfect. This is an opportunity for everyone to get a better understanding of what it does as well as for myself to make improvements.

I encourage everyone to email other NFL simulators to find out how they're doing, then post that over here for a comparison. If you're going to be following their models, you should know how those models actually perform.

These numbers tell me that for the most part, everything is going very well. Some changes I need to make include: more passes, decrease the average rush yards, decrease fumble %, and adjust 3rd down play selection. No major changes, just little tweaks. Otherwise, things are going swimmingly. Send me some feedback, I'd like to hear what everyone thinks.

PASSING

ATT/GAME NFLSim NFL
Average 27.2 32.4


COMP/G

Average 17.0 19.8


COMP %

Average 62.3% 61.3%


YDS/G

Average 192.2 212.9


YDS/PASS

Average 7.06 6.97
PASS TD/G


Average 1.60 1.30


INT/G

Average 0.79 0.90


SACK/G

Average 2.1 2.1


QB RATING

Average 91.0 83.6


RUSHING

ATT/GAME NFLSim NFL
Average 27.6 27.3


YDS/G

Average 118.4 112.3


YDS/RUSH

Average 4.3 4.1


RUSH TD/G

Average 1.2 0.9


FUM/G

Average 0.6 0.4


GAME STATS

PTS/G NFLSim NFL
Average 22.9 22.2


PLAYS/G

Average 60.3 61.8


TOTAL YDS/G

Average 310.6 325.2


YDS/PLAY

Average 5.2 5.3


3rd DN %

Average 25.8% 39.4%


YDS/PT

Average 13.6 14.9

Wednesday, November 5, 2008

Midseason Progressive Results

And now, what everyone's been waiting for. We're about halfway through the season, so I think it's time to post NFLSim's impressive progressive results. I chose to leave out week 2 because It was still too early for me to be making predictions based on 1 week of data. I'm going to post Accuscore's results as well for a comparison. They're the only other play-by-play NFL simulator I know of and they're a well established, well funded, syndicated, sponsored, and mathematically sophisticated operation. David and Goliath? Let's see...

I'm going to give you several different numbers. First, I'll give you the overall numbers, as in the collective 50-100% predictions for winner, spread, and o/u. Then you'll get their numbers broken down. I'll show you weekly trends, % trends, etc.

Overall numbers:
Winner: 65-34 (65.7%)
Spread: 47-45 (51.5%)
O/U: 50-43 (53.8%)
Spread and O/U combined: 97-88 (53.8%)

Accuscore numbers:
Winner: 87-43 (66.9%)
Spread: 51-50 (50.5%)
O/U: 67-50 (57.2%)
Spread and O/U combined: 118-100 (54.1%)

Accuscore has a slight edge when picking the winner, I have a slight edge picking ATS, and Accuscore has a sizeable advantage picking O/U. BUT! Let's look at how Black Box Sports picks compare when confidence is at least 60%. This confidence is really where NFLSim shines. Here is Black Box Sports's record when the confidence is over 60% compared to Accuscore's overall record (can't find any confidence values for picks). Fasten your seat belts.

Black Box Sports +60%:
Winner: 41-19 (68.3%) ... 22-8 (73.3%) when greater than 70%
Spread: 36-21 (63.2%)
O/U: 21-10 (67.7%)
Spread and O/U: 57-31 (64.7%)
Betting 100 units on the spread and over/under, you made +2290, ROI of 26%, halfway through the season.

Once again, Accuscore's numbers:
Accuscore:
Winner: 87-43 (66.9%)
Spread: 51-50 (50.5%)
O/U: 67-50 (57.2%)
Spread and O/U combined: 118-100 (54.1%)

Picking the winner, I'm ahead by 1.4% when at least 60% confidence, 6.4% when at least 70% confidence. Spread, I'm ahead by 12.7%. O/U, up by 10.5%. Combined, I'm up by 10.6%. That's what I'm talking about. Not to mention I offer all the picks for free... Spread the word everyone.

In tabular format:
Winner
Wins Games Win %

50-59 24 39 61.5%

60-69 19 30 63.3%

70-79 17 24 70.8%

80-89 4 4 100.0%

90-100 1 2 50.0%

Total 65 99 65.7%


Spread
Wins Games Win %

50-59 11 35 31.4%

60-69 24 37 64.9%

70-79 11 16 68.8%

80-89 0 3 0.0%

90-100 1 1 100.0%

Total 47 92 51.1%


Over
Wins Games Win %

50-59 29 62 46.8%

60-69 15 22 68.2%

70-79 2 4 50.0%

80-89 2 3 66.7%

90-100 2 2 100.0%

Total 50 93 53.8%

S&O/U


50-59 40 97 41.2%

60-69 39 59 66.1%

70-79 13 20 65.0%

80-89 2 6 33.3%

90-100 3 3 100.0%

Total 97 185 52.4%

Graphically:
Theoretically, as in, if NFLSim was a perfect analog of reality, those dashed lines would be perfectly in line with the thick black line. It would mean that the confidence values are always spot on and the games end exactly the way they should. If the trend (dashed) lines are below the thick line, the confidence values are not as accurate as reality. The more parallel the thick and trend lines are, the more accurate the changes in confidenc values are, i.e., as confidence increases, the accuracy increases at the correct rate. If that makes any sense. This graph shows all the picks.
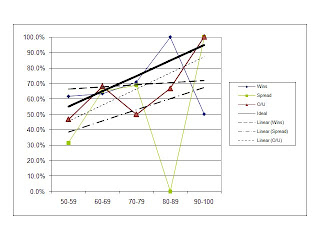

You'll notice that above, the win % for 90-100 is at 50%. In week 3, the 90.03% favorite NE lost to MIA. 0.03% is just about a difference of 1 game in the entire set of hundreds and hundreds of simulated games. Had NE been an 89.97% favorite, the graph would look like this:
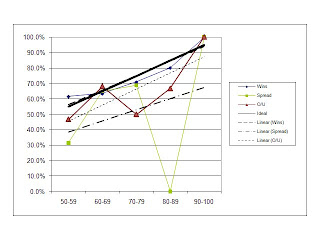

Check out the 'Wins' line. The Wins line overlaps the theoretical line. You can't even see it. That's absolutely absurd, especially after 100 games. The trendline has a slope of .09, compared to the theoretical line's .1. The "Wins" trendline has an R-squared value (a measure of how closely the data points fit the line) of 0.89. Absolutely insane. In general, I try to temper my enthusiasm, but this is unbelievable... This means that when NFLSim says a team will win 63% of the time, that team will win 63% of the time. For those of you math-minded people, the expected number of wins is approximately 64.15. The actual number of wins is 65. That blows my mind.

Here's a team-by-team accuracy breakdown:

Win % Cover Spread % Over %
ARI 83.3% 40.0% 50.0%
ATL 66.7% 50.0% 33.3%
BAL 57.1% 42.9% 71.4%
BUF 66.7% 50.0% 66.7%
CAR 83.3% 40.0% 50.0%
CHI 50.0% 50.0% 66.7%
CIN 71.4% 71.4% 33.3%
CLE 42.9% 42.9% 57.1%
DAL 57.1% 57.1% 57.1%
DEN 50.0% 33.3% 20.0%
DET 100.0% 66.7% 40.0%
GB 100.0% 66.7% 66.7%
HOU 71.4% 57.1% 85.7%
IND 33.3% 50.0% 33.3%
JAX 33.3% 66.7% 60.0%
KC 83.3% 66.7% 83.3%
MIA 33.3% 66.7% 50.0%
MIN 83.3% 66.7% 50.0%
NE 33.3% 20.0% 20.0%
NO 66.7% 33.3% 50.0%
NYG 66.7% 16.7% 20.0%
NYJ 71.4% 57.1% 57.1%
OAK 57.1% 14.3% 57.1%
PHI 66.7% 0.0% 66.7%
PIT 50.0% 66.7% 66.7%
SD 83.3% 50.0% 33.3%
SEA 83.3% 50.0% 33.3%
SF 50.0% 33.3% 40.0%
STL 57.1% 50.0% 28.6%
TB 71.4% 42.9% 57.1%
TEN 100.0% 66.7% 83.3%
WAS 42.9% 28.6% 33.3%

I'll post some more stats if I have a chance.
Enjoy!

I'd love to hear everyone's reactions and questions, so don't be shy, send me some emails.

Friday, October 31, 2008

Week 9: Predictions

ARI -3 at STL, 48
Winner:
ARI, 51%
Spread:
STL +3, 61%
O/U:
OVER, 54%

BAL at CLE -1.5, 36.5
Winner:
BAL, 59%
Spread:
BAL +1.5, 61%
O/U:
OVER, 53%

DET at CHI -13, 43
Winner:
CHI, 79%
Spread:
DET +13, 64%
O/U:
OVER, 61%

GB at TEN -5.5, 41.5
Winner:
TEN, 64%
Spread:
GB +5.5, 53%
O/U:
UNDER, 51%

HOU at MIN -4.5, 47
Winner:
MIN, 51%
Spread:
HOU +4.5, 62%
O/U: OVER, 52%

JAX -7.5 at CIN, 40
Winner:
JAX, 59%
Spread:
CIN +7.5, 64%
O/U:
OVER, 61%

NYJ at BUF -5.5, 42
Winner:
BUF, 66%
Spread:
BUF -5.5, 54%
O/U:
OVER, 55%

TB -9 at KC, 36.5
Winner:
TB, 60%
Spread:
KC +9, 68%
O/U: OVER, 68%

MIA at DEN -3.5, 49
Winner:
MIA, 56%
Spread:
MIA +3.5, 72%
O/U: OVER, 55%

ATL -3 at OAK, 41
Winner:
OAK, 54%
Spread:
OAK +3, 65%
O/U: OVER, 61%

DAL at NYG -9, 41
Winner:
NYG, 79%
Spread:
DAL +9, 54%
O/U:
UNDER, 58%

PHI -7 at SEA, 43
Winner:
PHI, 76%
Spread:
SEA +7, 52%
O/U:
OVER, 60%

NE at IND -6, 44
Winner:
NE, 57%
Spread:
NE +6, 74%
O/U:
OVER, 58%

PIT at WAS -1.5, 37
Winner:
WAS, 67%
Spread:
WAS -1.5, 65%
O/U:
OVER, 54%

Week 9: Fun Facts

Upsets: BAL over CLE (59%), MIA over DEN (56%), OAK over ATL (54%), NE over IND (57%)
Blowouts: CHI over DET (79.2%), NYG over DAL (78.8%)
Close Calls: ARI over STL (50.7%), MIN over HOU (50.9%)
Most Points: PHI
Fewest Points: DAL
Most Total Yards: MIA, 379.3 yards
Fewest Total Yards: CLE, 251.2 yards
Best QB: Kyle Orton (CHI), 114.8 rating
Worst QB: Brad Johnson (DAL), 72.3 rating
Top Rushing Team: TEN, 154.4 yards
Worst Rushing Team: ARI, 79.8 yards
Most Takeaways: JAX
Longest Time of Possession: CHI
Most Punts: DAL, 5.3
Fewest Punts: MIA, 3.7
Most Plays: TB, 68
Fewest Plays: STL, 56

Week 9 YDS/PASS YDS/PLAY YDS/PT QB RATING
Arizona Cardinals 8.00 5.57 13.65 101.53
Atlanta Falcons 6.76 5.10 14.76 86.10
Baltimore Ravens 6.54 4.72 15.27 84.46
Buffalo Bills 7.58 5.00 11.77 103.39
Carolina Panthers


Chicago Bears 8.74 5.80 12.37 114.84
Cincinnati Bengals 7.12 5.12 14.24 89.59
Cleveland Browns 6.16 4.51 14.43 75.74
Dallas Cowboys 5.97 4.29 16.73 72.27
Denver Broncos 8.25 5.77 14.05 102.46
Detroit Lions 6.15 4.59 14.93 79.76
Green Bay Packers 6.71 4.63 15.30 87.76
Houston Texans 7.20 4.88 13.32 95.11
Indianapolis Colts 7.65 5.46 13.43 92.97
Jacksonville Jaguars 6.76 4.68 12.52 98.28
Kansas City Chiefs 6.23 4.82 14.72 77.92
Miami Dolphins 8.37 5.85 13.58 114.15
Minnesota Vikings 7.46 5.68 14.05 91.74
New England Patriots 6.87 4.80 12.27 97.46
New Orleans Saints


New York Giants 7.04 5.33 13.16 98.93
New York Jets 6.88 5.05 16.27 87.71
Oakland Raiders 6.65 5.38 12.99 87.62
Philadelphia Eagles 7.92 5.55 12.66 109.18
Pittsburgh Steelers 6.14 4.18 15.47 80.32
San Diego Chargers


San Francisco 49ers


Seattle Seahawks 6.28 4.74 14.82 75.86
St. Louis Rams 7.88 5.52 12.08 103.17
Tampa Bay Buccaneers 6.54 5.25 15.26 87.36
Tennessee Titans 5.87 5.00 12.72 75.19
Washington Redskins 7.32 5.05 13.41 99.88


Average 7.04 5.08 13.94 91.81

Tuesday, October 21, 2008

Week 7: Results

I'm happy with this week's straight pick results. Hit 2 out of 4 upsets. Hit 10 out of 14 total (71.4%). The picks that lost had confidences of 51, 52, 53, and 67%. I can live with that. I'm very happy with the result of the Dallas - St. Louis game. My injury adjuster worked very well. In fact, the average simulated scores actually had STL outscoring DAL 21.79 to 21.02. That was one of the rare times that the average scores disagree with the win %.
These occurrences include: Week 7, MIN 52% (Correct), CHI 20.29 to MIN 20.13; Week 6, GB 54% (Correct), GB 24.95 to SEA 25.05. So when confidence and average point differentials disagree, confidence is 2-1.

It's also encouraging that as confidence % increases, accuracy increases. The progressive results are looking good. After the half-way point of the season, I'll write up a detailed report.

BOA had a great week, up 91%, further proving the volatility which I'm not comfortable with.

By the way, if I ever make any mistakes, let me know so I can fix it.

BAL at MIA -3, 36.5
Winner:
MIA, 67%
Spread:
MIA -3, 56%
O/U: OVER, 60%

DAL -7 at STL, 43.5
Winner:
DAL, 51%
Spread:
STL +7, 74%
O/U:
UNDER, 52%

MIN at CHI -3, 38
Winner:
MIN, 52%
Spread:
MIN +3, 59%
O/U:
OVER, 54%

NO at CAR -3, 44.5
Winner:
CAR, 53%
Spread:
NO +3, 59%
O/U:
UNDER, 62%

PIT -9.5 at CIN, 35
Winner:
PIT, 60%
Spread:
CIN +9.5, 63%
O/U:
OVER, 62%

SD at BUF EVEN, 44.5
Winner:
BUF, 64%
Spread:
BUF, 64%
O/U:
OVER, 55%

SF at NYG -10.5, 46
Winner:
NYG, 67%
Spread:
SF +10.5, 68%
O/U:
UNDER, 53%

TEN -9 at KC, 35.5
Winner:
TEN, 69%
Spread:
KC +9, 61%
O/U:
OVER, 66%

DET at HOU -9.5, 46.5
Winner:
HOU, 82%
Spread:
HOU -9.5, 59%
O/U:
OVER, 58%

CLE at WAS -7, 42
Winner:
WAS, 77%
Spread:
WAS -7, 55%
O/U:
OVER, 53%

IND -2 at GB, 47
Winner:
GB, 60%
Spread:
GB +2, 65%
O/U:
UNDER, 53%

NYJ -3 at OAK, 41
Winner:
OAK, 55%
Spread:
OAK +3, 65%
O/U:
OVER, 63%

SEA at TB -10.5, 38
Winner:
TB, 69%
Spread:
SEA +10.5, 59%
O/U:
OVER, 63%

DEN at NE -3, 48
Winner:
DEN, 53%
Spread: DEN +3, 63%
O/U: OVER, 53%


Straight % Wins Games Win %

50-59 2 5 40.0%

60-69 6 7 85.7%

70-79 1 1 100.0%

80-89 1 1 100.0%

90-100 0 0

Total 10 14 71.4%


Spread % Wins Games Win %

50-59 1 6 16.7%

60-69 4 7 57.1%

70-79 1 1 100.0%

80-89 0 0

90-100 0 0

Total 6 14 42.9%


Total
Wins Games Win %

50-59 2 6 33.3%

60-69 4 6 66.7%

70-79 0 0

80-89 0 0

90-100 0 0

Total 6 12 50.0%

Friday, October 17, 2008

Week 7: Requested Stats

A while back I got a request to post yds/pass, yds/play, and yds/pt. At this point in the season, I think the numbers are getting accurate, so here are those stats for week 7.

TEAM YDS/PASS YDS/PLAY YDS/PT
Arizona Cardinals


Atlanta Falcons


Baltimore Ravens 6.80 4.49 17.28
Buffalo Bills 7.59 5.32 12.65
Carolina Panthers 6.73 4.93 13.74
Chicago Bears 7.00 4.76 14.23
Cincinnati Bengals 6.39 4.18 13.41
Cleveland Browns 5.86 4.39 15.53
Dallas Cowboys 7.05 5.06 15.32
Denver Broncos 7.41 5.49 12.96
Detroit Lions 6.95 5.04 17.51
Green Bay Packers 8.11 5.71 13.52
Houston Texans 8.09 6.11 11.36
Indianapolis Colts 6.34 4.70 13.02
Jacksonville Jaguars


Kansas City Chiefs 5.38 4.38 14.60
Miami Dolphins 6.91 4.91 12.52
Minnesota Vikings 6.20 4.38 13.67
New England Patriots 7.88 5.68 14.57
New Orleans Saints 7.37 4.94 15.57
New York Giants 7.54 5.91 13.10
New York Jets 7.72 5.22 15.12
Oakland Raiders 6.71 4.94 11.81
Philadelphia Eagles


Pittsburgh Steelers 6.05 4.14 12.52
San Diego Chargers 7.31 4.94 14.76
San Francisco 49ers 7.09 4.93 14.95
Seattle Seahawks 5.83 4.46 15.55
St. Louis Rams 6.90 5.00 12.57
Tampa Bay Buccaneers 7.25 5.55 12.96
Tennessee Titans 6.62 4.90 13.98
Washington Redskins 7.49 5.63 12.20


Average 6.949 5.002 13.962

Friday, October 10, 2008

Week 6: Top 5 / Bottom 5

(The game predictions are below this post)
Let's have a little fun this week.

The top 5 QB's by rating will be:

1. Aaron Rodgers, GB: 109.3
2. Jason Campbell, WAS: 109.2
3. Chad Pennington, MIA: 105.7
4. Jay Cutler, DEN: 104.0
5. Gus Frerotte, MIN: 103.4
Botom 5:
28. Jeff Garcia (in for Griese), TB: 83.0
29. Dan Orlovsky (in for Kitna), DET: 82.0
30. Derek Anderson, CLE: 75.4
31. Peyton Manning, IND: 73.1
32. Charlie Frye (in for Hasselbeck), SEA: 71.5

Top 5 teams by rushing yards:
1. Washington Redskins: 178.3
2. Atlanta Falcons: 171.8
3. Baltimore Ravens: 165.3
4. Oakland Raiders: 160.8
5. Seattle Seahawks: 160.6
Bottom 5:
28. Philadelphia Eagles: 75.3
29. New Orleans Saints: 72.7
30. Cincinnati Bengals: 63.4
31. Indianapolis Colts: 47.4
32. Detroit Lions: 46.5

Top 5 offenses by Points Scored:
1. Minnesota Vikings: 30.8
2. Denver Broncos: 30.2
3. San Diego Chargers: 29.0
4. Washington Redskins: 27.6
5. New York Giants: 27.5
Bottom 5:
28. Carolina Panthers: 19.8
29. Detroit Lions: 18.8
30. Indianapolis Colts: 18.4
31. St. Louis Rams: 18.4
32. Cleveland Browns: 17.8

Top 5 Defenses by Yards Allowed:
1. New York Giants: 229.7
2. Baltimore Ravens: 234.4
3. New York Jets: 260.6
4. Minnesota Vikings: 278.4
5. Washington Redskins: 280.2
Bottom 5:
28. Seattle Seahawks: 350.5
29. Detroit Lions: 355.6
30. Denver Broncos: 357.5
31. Houston Texans: 367.0
32. St. Louis Rams: 395.0

That's enough for now. Any opinions?

Week 6: Predictions

Better late than never.

Week 6 Upsets: BAL, ATL, MIA, OAK, GB. Last week, NFLSim went 3-2 with upsets, so let's see how it does this week.

BAL at IND -5, 39
Winner: BAL, 58%
Spread: BAL +5, 72%
O/U: OVER, 51%

CAR at TB -1, 36.5
Winner: TB, 58%
Spread: TB -1, 56%
O/U: OVER, 69%

CHI -3 at ATL, 43.5
Winner: ATL, 57%
Spread: ATL +3, 67%
O/U: OVER, 58%

CIN at NYJ -6, 44.5
Winner: NYJ, 65%
Spread: CIN +6, 51%
O/U: OVER, 56%

DET at MIN -14, 45.5
Winner: MIN, 79%
Spread: DET +14, 61%
O/U: OVER, 59%

MIA at HOU -3, 44.5
Winner: MIA, 51%
Spread: MIA +3, 66%
O/U: OVER, 70%

OAK at NO -7.5, 47
Winner: OAK, 55%
Spread: OAK +7.5, 80%
O/U: UNDER, 57%

STL at WAS -13.5, 44.5
Winner: WAS, 76%
Spread: STL +13.5, 63%
O/U: OVER, 54%

JAX at DEN -3.5, 48
Winner: DEN, 75%
Spread: DEN -3.5, 63%
O/U: OVER, 57%

DAL -6 at ARI, 50
Winner: DAL, 51%
Spread: ARI +6, 70%
O/U: UNDER, 54%

GB at SEA -3, 47
Winner: GB, 54%
Spread: GB +3, 60%
O/U: OVER, 57%

PHI -5 at SF, 43
Winner: PHI, 59%
Spread: SF +5, 52%
O/U: OVER, 58%

NE at SD -6, 45
Winner: SD, 60%
Spread: NE +6, 59%
O/U: OVER, 72%

NYG -8 at CLE, 43
Winner: NYG, 76%
Spread: NYG -8, 51%
O/U: OVER, 55%

Saturday, October 4, 2008

Week 5: Predictions

SEA at NYG -7
Winner: NYG, 70%
Spread: SEA +7, 56%
O/U: UNDER, 55%

WAS at PHI -6
Winner: PHI, 73%
Spread: PHI -6, 51%
O/U: UNDER, 56%

SD -6.5 at MIA
Winner: SD, 54%
Spread: MIA +6.5, 67%
O/U: OVER, 72%

KC at CAR -9.5
Winner: CAR, 61%
Spread: KC, 68%
O/U: UNDER, 54%

TEN -3 at BAL
Winner: TEN, 51%
Spread: BAL +3, 62%
O/U: OVER, 55%

IND -3.5 at HOU
Winner: HOU, 63%
Spread: HOU +3.5, 68%
O/U: OVER, 56%

CHI -3.5 at DET
Winner: CHI, 73%
Spread: CHI -3.5, 64%
O/U: OVER, 57%

ATL at GB -3.5
Winner: ATL, 67%
Spread: ATL +3.5, 74%
O/U: OVER, 64%

TB at DEN -3
Winner: DEN, 55%
Spread: TB +3, 55%
O/U: OVER, 56%

CIN at DAL -17
Winner: DAL, 73%
Spread: CIN +17, 72%
O/U: OVER, 51%

BUF at ARI EVEN
Winner: BUF, 74%
Spread: ---
O/U: OVER, 51%

NE -3.5 at SF
Winner: SF, 54%
Spread: SF +3.5, 67%
O/U: UNDER, 51%

PIT at JAX -4
Winner: PIT, 61%
Spread: PIT +4, 72%
O/U: OVER, 62%

MIN at NO -3
Winner: MIN, 52%
Spread: MIN+6, 60%
O/U: UNDER, 58%

Thursday, September 18, 2008

Bet Optimization Algorithm

The results for week 2 were none too impressive, but this makes my Bet Optimization Algorithm ("BOA") look much better. Simply put, BOA takes up to 21 individual bets, i.e. NYG win, MIA win, DAL win, MIN +3, etc., the payouts on those bets that Vegas offers, and the confidence NFLSim generates. Using the algorithms, BOA generates the optimal bets as well as what percentage of your bankroll you should wager on each bet. It spits out single bets and parlays of up to 6 teams. I didn't post the BOA's suggestions last week because I didn't want anyone relying on it, but I'll put them up for week 3. Keep in mind, it's still early in the season so things aren't as accurate as they could be, so be careful. Use at your own risk. Anyway, here's what it said to bet on last week. It generated a return on investment of 64% on the bets (all 31 of them). I'd say that's pretty successful.

To make it easier for me, I assign a number to each bet. All bets are on straight up winners on the moneyline, NO SPREAD. If there are numbers separated by a commas, those are parlays. All calculations are based on a total bankroll of $100. Makes calculations easier.

~"BOA ODDS" are BOA's calculated probability that the bet will win.
~"VEGAS PAYOUT" is the payout for that bet according to Vegas, in decimal form.
~"% OF BANKROLL" is the amount bankroll devoted to that bet.
~"POSSIBLE PAYOUT" is the amount won if the bet is won. (BANKROLL * % OF BANKROLL * VEGAS PAYOUT)
~"ACTUAL PAYOUT" is 0.00 if the bet loses or POSSIBLE PAYOUT if it wins.

1-BUF, 2-CHI, 3-DET, 4-MIN, 5-NO, 6-NYG, 7-KC, 8-TEN, 9-ATL, 10-SF, 11-BAL, 12-ARI, 13-NYJ, 14-DEN, 15-PIT, 16-PHI


BET BOA ODDS VEGAS PAYOUT % OF BANKROLL POSSIBLE PAYOUT

ACTUAL PAYOUT
15 91.00% 1.36 4.72% 6.41

6.41
9 80.00% 3.50 4.15% 14.53

0.00
10 79.00% 3.50 4.08% 14.28

14.28
7 81.00% 1.51 3.82% 5.77

0.00
8 79.00% 1.95 3.81% 7.44

7.44
9,15 72.80% 4.76 3.75% 17.85

0.00
10,15 71.89% 4.76 3.69% 17.55

17.55
8,15 71.89% 2.65 3.43% 9.08

9.08
14 74.00% 2.00 3.41% 6.82

6.82
7,15 73.71% 2.05 3.40% 6.99

0.00
9,10 63.20% 12.25 3.36% 41.21

0.00
7,9 64.80% 5.29 3.25% 17.17

0.00
8,9 63.20% 6.83 3.23% 22.05

0.00
7,10 63.99% 5.29 3.20% 16.89

0.00
8,10 62.41% 6.83 3.18% 21.70

21.70
6 76.00% 1.20 3.13% 3.76

3.76
14,15 67.34% 2.72 3.09% 8.41

8.41
16 65.00% 3.50 3.07% 10.76

0.00
9,10,15 57.51% 16.66 3.07% 51.17

0.00
9,14 59.20% 7.00 2.98% 20.88

0.00
7,9,15 58.97% 7.19 2.98% 21.39

0.00
8,9,15 57.51% 9.28 2.96% 27.46

0.00
10,14 58.46% 7.00 2.94% 20.55

20.55
7,10,15 58.23% 7.19 2.93% 21.06

0.00
8,10,15 56.79% 9.28 2.91% 27.05

27.05
7,8 63.99% 2.94 2.89% 8.52

0.00
1 64.00% 2.90 2.88% 8.36

8.36
6,9 60.80% 4.20 2.88% 12.08

0.00
7,8,9,10,15 36.80% 49.06 1.98% 97.36

0.00
7,9,10,15 46.58% 25.16 2.48% 62.51

0.00
1,8 50.56% 5.66 2.34% 13.22

13.22

Total Bankroll: $100
Total Winnings: $164.62
Total Profit: $64.62
Return on Investment: 64.62%

So even when the predictions aren't terribly accurate (53.3%), BOA is able to perform well based on the idea that the probabilities generated by NFLSim are equivalent to the probabilities in reality. Hopefully, for everyone, this will continue.