Wednesday, November 12, 2008

Week 10: Results

Week 10 was disappointing in terms of ATS and O/U, but NFLSim picked 11-3 straight up, so it wasn't all bad. The 50-59% games really got slammed, but if you read the Midseason Progressive Results post, you wouldn't have bet on them anyway. After this week, 60+% ATS and O/U picks are still 61.3 and 66.7% on the season, respectively.

I just found out about another NFL simulator over at www.whatifsports.com, a division of Fox Sports. Actually, they've got a pretty cool setup. They let you simulate games using teams from different seasons. I can't find their pick record, but someone posted that they are 69.5% straight up and 53.7% ATS on the season. No confidence numbers were available. On the season they beat AccuScore and NFLSim by a few % points, but when picks are made based on confidence, NFLSim has a substantial edge.


Straight % Wins Games Win %

50-59 6 7 85.7%

60-69 2 4 50.0%

70-79 3 3 100.0%

80-89 0 0 ---

90-100 0 0 ---

Total 11 14 78.6%


Spread % Wins Games Win %

50-59 1 9 11.1%

60-69 1 2 50.0%

70-79 1 3 33.3%

80-89 0 0 ---

90-100 0 0 ---

Total 3 14 21.4%


Total
Wins Games Win %

50-59 4 12 33.3%

60-69 1 2 50.0%

70-79 0 0 ---

80-89 0 0 ---

90-100 0 0 ---

Total 5 14 35.7%

Midterms

Midterms Wednesday and Thursday... must study... Will update everything as soon as I get a chance... Prediction will be up for Thursday night's game. Wish me luck.

Saturday, November 8, 2008

Week 10: Stats

Week 10 YDS/PASS YDS/PLAY YDS/PT QB RATING
Arizona Cardinals 8.00 5.56 13.15 100.01
Atlanta Falcons 7.22 5.66 13.20 92.22
Baltimore Ravens 7.36 5.11 15.52 93.18
Buffalo Bills 7.94 5.19 14.73 98.63
Carolina Panthers 7.16 4.86 14.57 91.76
Chicago Bears 6.11 4.61 14.78 75.65
Cincinnati Bengals


Cleveland Browns 7.28 5.54 15.23 94.43
Dallas Cowboys


Denver Broncos 6.66 4.86 14.36 86.49
Detroit Lions 6.96 5.28 13.30 88.59
Green Bay Packers 7.47 4.81 15.07 97.89
Houston Texans 7.03 5.10 12.87 87.90
Indianapolis Colts 6.29 4.23 14.22 83.05
Jacksonville Jaguars 7.64 5.19 13.66 104.95
Kansas City Chiefs 6.40 4.71 15.77 86.89
Miami Dolphins 8.67 5.82 11.95 114.71
Minnesota Vikings 6.52 5.15 12.83 79.25
New England Patriots 7.33 5.27 13.84 98.26
New Orleans Saints 7.52 5.31 14.65 97.86
New York Giants 6.51 4.90 17.03 82.74
New York Jets 8.19 6.33 14.13 99.00
Oakland Raiders 6.41 5.02 14.70 83.72
Philadelphia Eagles 7.36 5.41 12.26 95.03
Pittsburgh Steelers 7.40 4.90 13.56 92.85
San Diego Chargers 8.19 6.01 13.93 100.77
San Francisco 49ers 7.41 4.94 14.65 92.78
Seattle Seahawks 6.06 4.45 16.49 76.96
St. Louis Rams 6.68 4.48 14.09 89.97
Tampa Bay Buccaneers


Tennessee Titans 5.56 4.30 12.83 79.03
Washington Redskins


Average 7.12 5.11 14.19 91.59

Thursday, November 6, 2008

Week 10: Predictions

Ok, here's the new format. Same thing as before, but no I add the average scores as well. Underneath the matchup are the average scores. DEN's average score over the course of 500 simulations was 21.25 and CLE's average score was 21.40. Average scores aren't predictions of the score, they're just measures of relative performance. Every once in a while, one team will be favored to win even though on average they score less. This is the case with the DEN game. I wish there was an easier way to cram more stats into each game, but this blog format is really limiting.

I'm also planning on posting games as I finish them. One last change, instead of reposting everything an a "Results" section, i'm going to color everything in the "Prediction" section. A small "Results" section will sum up the weekend.

Only 2 upsets this week, DEN over CLE (52%) and HOU over BAL (57%). More 'UNDER's than usual. More favorites covering the spread, as well.

DEN at CLE -3.5, 45.5
DEN: 21.25
CLE: 21.40
Winner: DEN, 52%
Spread: DEN +3.5, 60%
O/U: UNDER, 61%

BAL -1 at HOU, 42
BAL:
21.57
HOU:
23.12
Winner:
HOU, 57%
Spread: HOU +1, 59%
O/U:
OVER, 55%

BUF at NE -3.5, 41.5
BUF:
22.10
NE:
23.41
Winner:
NE, 55%
Spread: BUF +3.5, 54%
O/U: OVER, 59%

GB at MIN -2, 45.5
GB:
19.95
MIN:
23.45
Winner:
MIN, 57%
Spread:
MIN -2, 54%
O/U:
UNDER, 59%

JAX -6.5 at DET, 44.5
JAX:
24.65
DET:
22.00
Winner:
JAX, 56%
Spread:
DET +6.5, 64%
O/U:
OVER, 56%

NO at ATL -1, 50
NO:
22.22
ATL:
26.39
Winner:
ATL, 59%
Spread: ATL -1, 58%
O/U: UNDER, 57%

SEA at MIA -8.5, 43
SEA:
17.19
MIA:
29.42
Winner:
MIA, 79%
Spread:
MIA -8.5, 54%
O/U: OVER, 59%

STL at NYJ -8.5, 44
STL:
19.05
NYJ:
27.06
Winner:
NYJ, 70%
Spread:
STL +8.5, 51%
O/U: OVER, 53%

TEN -3 at CHI, 38.5
TEN:
22.33
CHI:
18.47
Winner:
TEN, 60%
Spread:
CHI +3, 51%
O/U:
OVER, 52%

CAR -9.5 at OAK, 37.5
CAR:
21.15
OAK:
19.93
Winner:
CAR, 54%
Spread:
OAK +9.5, 72%
O/U:
OVER, 58%

IND at PIT -3.5, 39.5
IND:
17.97
PIT:
22.27
Winner:
PIT, 62%
Spread:
PIT -3.5, 54%
O/U:
UNDER, 51%

KC at SD -15, 47
KC:
18.93
SD:
26.02
Winner:
SD, 70%
Spread:
KC +15, 74%
O/U: UNDER, 60%

NYG at PHI -3, 43.5
NYG:
18.88
PHI:
25.48
Winner:
PHI, 65%
Spread:
PHI -3, 58%
O/U: OVER, 52%

SF at ARI -9.5, 45.5
SF:
20.34
ARI:
24.25
Winner:
ARI, 63%
Spread:
SF +9.5, 70%
O/U:
UNDER, 57%

Wednesday, November 5, 2008

Midseason Progressive Results

And now, what everyone's been waiting for. We're about halfway through the season, so I think it's time to post NFLSim's impressive progressive results. I chose to leave out week 2 because It was still too early for me to be making predictions based on 1 week of data. I'm going to post Accuscore's results as well for a comparison. They're the only other play-by-play NFL simulator I know of and they're a well established, well funded, syndicated, sponsored, and mathematically sophisticated operation. David and Goliath? Let's see...

I'm going to give you several different numbers. First, I'll give you the overall numbers, as in the collective 50-100% predictions for winner, spread, and o/u. Then you'll get their numbers broken down. I'll show you weekly trends, % trends, etc.

Overall numbers:
Winner: 65-34 (65.7%)
Spread: 47-45 (51.5%)
O/U: 50-43 (53.8%)
Spread and O/U combined: 97-88 (53.8%)

Accuscore numbers:
Winner: 87-43 (66.9%)
Spread: 51-50 (50.5%)
O/U: 67-50 (57.2%)
Spread and O/U combined: 118-100 (54.1%)

Accuscore has a slight edge when picking the winner, I have a slight edge picking ATS, and Accuscore has a sizeable advantage picking O/U. BUT! Let's look at how Black Box Sports picks compare when confidence is at least 60%. This confidence is really where NFLSim shines. Here is Black Box Sports's record when the confidence is over 60% compared to Accuscore's overall record (can't find any confidence values for picks). Fasten your seat belts.

Black Box Sports +60%:
Winner: 41-19 (68.3%) ... 22-8 (73.3%) when greater than 70%
Spread: 36-21 (63.2%)
O/U: 21-10 (67.7%)
Spread and O/U: 57-31 (64.7%)
Betting 100 units on the spread and over/under, you made +2290, ROI of 26%, halfway through the season.

Once again, Accuscore's numbers:
Accuscore:
Winner: 87-43 (66.9%)
Spread: 51-50 (50.5%)
O/U: 67-50 (57.2%)
Spread and O/U combined: 118-100 (54.1%)

Picking the winner, I'm ahead by 1.4% when at least 60% confidence, 6.4% when at least 70% confidence. Spread, I'm ahead by 12.7%. O/U, up by 10.5%. Combined, I'm up by 10.6%. That's what I'm talking about. Not to mention I offer all the picks for free... Spread the word everyone.

In tabular format:
Winner
Wins Games Win %

50-59 24 39 61.5%

60-69 19 30 63.3%

70-79 17 24 70.8%

80-89 4 4 100.0%

90-100 1 2 50.0%

Total 65 99 65.7%


Spread
Wins Games Win %

50-59 11 35 31.4%

60-69 24 37 64.9%

70-79 11 16 68.8%

80-89 0 3 0.0%

90-100 1 1 100.0%

Total 47 92 51.1%


Over
Wins Games Win %

50-59 29 62 46.8%

60-69 15 22 68.2%

70-79 2 4 50.0%

80-89 2 3 66.7%

90-100 2 2 100.0%

Total 50 93 53.8%

S&O/U


50-59 40 97 41.2%

60-69 39 59 66.1%

70-79 13 20 65.0%

80-89 2 6 33.3%

90-100 3 3 100.0%

Total 97 185 52.4%

Graphically:
Theoretically, as in, if NFLSim was a perfect analog of reality, those dashed lines would be perfectly in line with the thick black line. It would mean that the confidence values are always spot on and the games end exactly the way they should. If the trend (dashed) lines are below the thick line, the confidence values are not as accurate as reality. The more parallel the thick and trend lines are, the more accurate the changes in confidenc values are, i.e., as confidence increases, the accuracy increases at the correct rate. If that makes any sense. This graph shows all the picks.


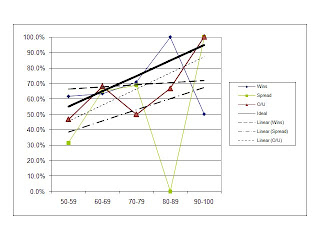
You'll notice that above, the win % for 90-100 is at 50%. In week 3, the 90.03% favorite NE lost to MIA. 0.03% is just about a difference of 1 game in the entire set of hundreds and hundreds of simulated games. Had NE been an 89.97% favorite, the graph would look like this:


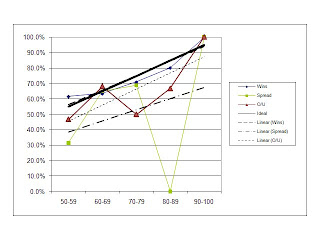
Check out the 'Wins' line. The Wins line overlaps the theoretical line. You can't even see it. That's absolutely absurd, especially after 100 games. The trendline has a slope of .09, compared to the theoretical line's .1. The "Wins" trendline has an R-squared value (a measure of how closely the data points fit the line) of 0.89. Absolutely insane. In general, I try to temper my enthusiasm, but this is unbelievable... This means that when NFLSim says a team will win 63% of the time, that team will win 63% of the time. For those of you math-minded people, the expected number of wins is approximately 64.15. The actual number of wins is 65. That blows my mind.

Here's a team-by-team accuracy breakdown:

Win % Cover Spread % Over %
ARI 83.3% 40.0% 50.0%
ATL 66.7% 50.0% 33.3%
BAL 57.1% 42.9% 71.4%
BUF 66.7% 50.0% 66.7%
CAR 83.3% 40.0% 50.0%
CHI 50.0% 50.0% 66.7%
CIN 71.4% 71.4% 33.3%
CLE 42.9% 42.9% 57.1%
DAL 57.1% 57.1% 57.1%
DEN 50.0% 33.3% 20.0%
DET 100.0% 66.7% 40.0%
GB 100.0% 66.7% 66.7%
HOU 71.4% 57.1% 85.7%
IND 33.3% 50.0% 33.3%
JAX 33.3% 66.7% 60.0%
KC 83.3% 66.7% 83.3%
MIA 33.3% 66.7% 50.0%
MIN 83.3% 66.7% 50.0%
NE 33.3% 20.0% 20.0%
NO 66.7% 33.3% 50.0%
NYG 66.7% 16.7% 20.0%
NYJ 71.4% 57.1% 57.1%
OAK 57.1% 14.3% 57.1%
PHI 66.7% 0.0% 66.7%
PIT 50.0% 66.7% 66.7%
SD 83.3% 50.0% 33.3%
SEA 83.3% 50.0% 33.3%
SF 50.0% 33.3% 40.0%
STL 57.1% 50.0% 28.6%
TB 71.4% 42.9% 57.1%
TEN 100.0% 66.7% 83.3%
WAS 42.9% 28.6% 33.3%

I'll post some more stats if I have a chance.
Enjoy!

I'd love to hear everyone's reactions and questions, so don't be shy, send me some emails.

Week 9: Results

OK results, nothing special. Hit 2 of 4 upsets, BAL over CLE -1.5 and MIA over DEN -3.5. There were a few close but disappointing games like the NE game.

Straight % Wins Games Win %

50-59 4 7 57.1%

60-69 2 4 50.0%

70-79 3 3 100.0%

80-89 0 0 ---

90-100 0 0 ---

Total 9 14 64.3%


Spread % Wins Games Win %

50-59 1 4 25.0%

60-69 4 8 50.0%

70-79 2 2 100.0%

80-89 0 0 ---

90-100 0 0 ---

Total 7 14 50.0%


Total
Wins Games Win %

50-59 4 9 44.4%

60-69 2 4 50.0%

70-79 0 0 ---

80-89 0 0 ---

90-100 0 0 ---

Total 6 13 46.2%


ARI -3 at STL, 48
Winner:
ARI, 51%
Spread:
STL +3, 61%
O/U:
OVER, 54%

BAL at CLE -1.5, 36.5
Winner:
BAL, 59%
Spread:
BAL +1.5, 61%
O/U:
OVER, 53%

DET at CHI -13, 43
Winner:
CHI, 79%
Spread:
DET +13, 64%
O/U:
OVER, 61%

GB at TEN -5.5, 41.5
Winner:
TEN, 64%
Spread:
GB +5.5, 53%
O/U:
UNDER, 51%

HOU at MIN -4.5, 47
Winner:
MIN, 51%
Spread:
HOU +4.5, 62%
O/U: OVER, 52%

JAX -7.5 at CIN, 40
Winner:
JAX, 59%
Spread:
CIN +7.5, 64%
O/U:
OVER, 61%

NYJ at BUF -5.5, 42
Winner:
BUF, 66%
Spread:
BUF -5.5, 54%
O/U:
OVER, 55%

TB -9 at KC, 36.5
Winner:
TB, 60%
Spread:
KC +9, 68%
O/U: OVER, 68%

MIA at DEN -3.5, 49
Winner:
MIA, 56%
Spread:
MIA +3.5, 72%
O/U: OVER, 55%

ATL -3 at OAK, 41
Winner:
OAK, 54%
Spread:
OAK +3, 65%
O/U: OVER, 61%

DAL at NYG -9, 41
Winner:
NYG, 79%
Spread:
DAL +9, 54%
O/U:
UNDER, 58%

PHI -7 at SEA, 43
Winner:
PHI, 76%
Spread:
SEA +7, 52%
O/U:
OVER, 60%

NE at IND -6, 44
Winner:
NE, 57%
Spread:
NE +6, 74%
O/U:
OVER, 58%

PIT at WAS -1.5, 37
Winner:
WAS, 67%
Spread:
WAS -1.5, 65%
O/U:
OVER, 54%

Friday, October 31, 2008

Week 9: Predictions

ARI -3 at STL, 48
Winner:
ARI, 51%
Spread:
STL +3, 61%
O/U:
OVER, 54%

BAL at CLE -1.5, 36.5
Winner:
BAL, 59%
Spread:
BAL +1.5, 61%
O/U:
OVER, 53%

DET at CHI -13, 43
Winner:
CHI, 79%
Spread:
DET +13, 64%
O/U:
OVER, 61%

GB at TEN -5.5, 41.5
Winner:
TEN, 64%
Spread:
GB +5.5, 53%
O/U:
UNDER, 51%

HOU at MIN -4.5, 47
Winner:
MIN, 51%
Spread:
HOU +4.5, 62%
O/U: OVER, 52%

JAX -7.5 at CIN, 40
Winner:
JAX, 59%
Spread:
CIN +7.5, 64%
O/U:
OVER, 61%

NYJ at BUF -5.5, 42
Winner:
BUF, 66%
Spread:
BUF -5.5, 54%
O/U:
OVER, 55%

TB -9 at KC, 36.5
Winner:
TB, 60%
Spread:
KC +9, 68%
O/U: OVER, 68%

MIA at DEN -3.5, 49
Winner:
MIA, 56%
Spread:
MIA +3.5, 72%
O/U: OVER, 55%

ATL -3 at OAK, 41
Winner:
OAK, 54%
Spread:
OAK +3, 65%
O/U: OVER, 61%

DAL at NYG -9, 41
Winner:
NYG, 79%
Spread:
DAL +9, 54%
O/U:
UNDER, 58%

PHI -7 at SEA, 43
Winner:
PHI, 76%
Spread:
SEA +7, 52%
O/U:
OVER, 60%

NE at IND -6, 44
Winner:
NE, 57%
Spread:
NE +6, 74%
O/U:
OVER, 58%

PIT at WAS -1.5, 37
Winner:
WAS, 67%
Spread:
WAS -1.5, 65%
O/U:
OVER, 54%