
It's 5:00 PM and the scores and picks are going up. Stats will follow later, so don't worry fantasy footballers
Week 4 Picks & Stats
Week 3 Picks & Stats
Week 2 Picks & Stats
Week 1 Picks & Stats
Hey, guys. I really like the stats that NFLSim is generating. The season averages of NFLSim's "important stats" (yards, avg's, etc.) are almost on par with the actual NFL stats. I want to expand this site to include more fantasy analysis and advice. I don't simulate individual player statistics, but I can show which teams will do particularly well in passing, rushing, kicking. I've received positive feedback regarding fantasy team management and I want to supersize that. What is the best format to present it?
---
DAL -3 at DEN, 42.5
The DAL-DEN game isn't a typo. DEN actually is an 88% favorite, 92% ATS. NFLSim works in mysterious ways and I'm here to interpret the results, so here goes...
DEN has a great defense; DAL has struggled to keep up.
DEN has yet to allow a single passing TD this season (and has only allowed 1 rushing TD).
DAL allows 20 pts/game.
DEN rarely allows big plays; a disorganized DAL defense has allowed 11 20+ yd and 2 40+ yd passes.
Orton is consistent; Romo is erratic and prone to turnovers, though he can make the big plays.
DEN's run game is very good and very consistent; Felix Jones will "more than likely" not play and Barber is coming off of minor injury.
DAL turns the ball over. DEN has home field advantage.
I used the word 'consistent' a couple times. Consistency is key for DEN to win this game. As long as they don't let the big bad Cowboys throw them off of their rhythm, they can plug a way and convert those possessions into points. For DAL to win, it is absolutely necessary for the D-line to pressure Orton into making some mistakes. Consistency, consistency, consistency. There's a good chance that this'll be a damn boring game until the last 5 minutes. DEN to win 88%, DEN +3 at 92%, OVER 42.5 at 57%. Be careful with this game because NFLSim went a little nuts.
---
FANTASY FOOTBALL!!
The spreadsheet now has a sheet called "Fantasy Projections". I rank all of the teams by their projected fantasy points... The numbers are averages over many games, so they may not represent the actual points scored by those entities. If you're stuck between starting Tom Brady and Peyton Manning, go for Brady this week, it looks like he's going to have a better game than Peyton. But if you have those two to choose from, you're probably in pretty good shape.
Showing posts with label NFLSim. Show all posts
Showing posts with label NFLSim. Show all posts
Wednesday, September 30, 2009
Thursday, November 6, 2008
Week 10: Predictions
Ok, here's the new format. Same thing as before, but no I add the average scores as well. Underneath the matchup are the average scores. DEN's average score over the course of 500 simulations was 21.25 and CLE's average score was 21.40. Average scores aren't predictions of the score, they're just measures of relative performance. Every once in a while, one team will be favored to win even though on average they score less. This is the case with the DEN game. I wish there was an easier way to cram more stats into each game, but this blog format is really limiting.
I'm also planning on posting games as I finish them. One last change, instead of reposting everything an a "Results" section, i'm going to color everything in the "Prediction" section. A small "Results" section will sum up the weekend.
Only 2 upsets this week, DEN over CLE (52%) and HOU over BAL (57%). More 'UNDER's than usual. More favorites covering the spread, as well.
DEN at CLE -3.5, 45.5
DEN: 21.25
CLE: 21.40
Winner: DEN, 52%
Spread: DEN +3.5, 60%
O/U: UNDER, 61%
BAL -1 at HOU, 42
BAL: 21.57
HOU: 23.12
Winner: HOU, 57%
Spread: HOU +1, 59%
O/U: OVER, 55%
BUF at NE -3.5, 41.5
BUF: 22.10
NE: 23.41
Winner: NE, 55%
Spread: BUF +3.5, 54%
O/U: OVER, 59%
GB at MIN -2, 45.5
GB: 19.95
MIN: 23.45
Winner: MIN, 57%
Spread: MIN -2, 54%
O/U: UNDER, 59%
JAX -6.5 at DET, 44.5
JAX: 24.65
DET: 22.00
Winner: JAX, 56%
Spread: DET +6.5, 64%
O/U: OVER, 56%
NO at ATL -1, 50
NO: 22.22
ATL: 26.39
Winner: ATL, 59%
Spread: ATL -1, 58%
O/U: UNDER, 57%
SEA at MIA -8.5, 43
SEA: 17.19
MIA: 29.42
Winner: MIA, 79%
Spread: MIA -8.5, 54%
O/U: OVER, 59%
STL at NYJ -8.5, 44
STL: 19.05
NYJ: 27.06
Winner: NYJ, 70%
Spread: STL +8.5, 51%
O/U: OVER, 53%
TEN -3 at CHI, 38.5
TEN: 22.33
CHI: 18.47
Winner: TEN, 60%
Spread: CHI +3, 51%
O/U: OVER, 52%
CAR -9.5 at OAK, 37.5
CAR: 21.15
OAK: 19.93
Winner: CAR, 54%
Spread: OAK +9.5, 72%
O/U: OVER, 58%
IND at PIT -3.5, 39.5
IND: 17.97
PIT: 22.27
Winner: PIT, 62%
Spread: PIT -3.5, 54%
O/U: UNDER, 51%
KC at SD -15, 47
KC: 18.93
SD: 26.02
Winner: SD, 70%
Spread: KC +15, 74%
O/U: UNDER, 60%
NYG at PHI -3, 43.5
NYG: 18.88
PHI: 25.48
Winner: PHI, 65%
Spread: PHI -3, 58%
O/U: OVER, 52%
SF at ARI -9.5, 45.5
SF: 20.34
ARI: 24.25
Winner: ARI, 63%
Spread: SF +9.5, 70%
O/U: UNDER, 57%
Wednesday, November 5, 2008
Midseason Progressive Results
And now, what everyone's been waiting for. We're about halfway through the season, so I think it's time to post NFLSim's impressive progressive results. I chose to leave out week 2 because It was still too early for me to be making predictions based on 1 week of data. I'm going to post Accuscore's results as well for a comparison. They're the only other play-by-play NFL simulator I know of and they're a well established, well funded, syndicated, sponsored, and mathematically sophisticated operation. David and Goliath? Let's see...
I'm going to give you several different numbers. First, I'll give you the overall numbers, as in the collective 50-100% predictions for winner, spread, and o/u. Then you'll get their numbers broken down. I'll show you weekly trends, % trends, etc.
Overall numbers:
Winner: 65-34 (65.7%)
Spread: 47-45 (51.5%)
O/U: 50-43 (53.8%)
Spread and O/U combined: 97-88 (53.8%)
Accuscore numbers:
Winner: 87-43 (66.9%)
Spread: 51-50 (50.5%)
O/U: 67-50 (57.2%)
Spread and O/U combined: 118-100 (54.1%)
Accuscore has a slight edge when picking the winner, I have a slight edge picking ATS, and Accuscore has a sizeable advantage picking O/U. BUT! Let's look at how Black Box Sports picks compare when confidence is at least 60%. This confidence is really where NFLSim shines. Here is Black Box Sports's record when the confidence is over 60% compared to Accuscore's overall record (can't find any confidence values for picks). Fasten your seat belts.
Black Box Sports +60%:
Winner: 41-19 (68.3%) ... 22-8 (73.3%) when greater than 70%
Spread: 36-21 (63.2%)
O/U: 21-10 (67.7%)
Spread and O/U: 57-31 (64.7%)
Betting 100 units on the spread and over/under, you made +2290, ROI of 26%, halfway through the season.
Once again, Accuscore's numbers:
Accuscore:
Winner: 87-43 (66.9%)
Spread: 51-50 (50.5%)
O/U: 67-50 (57.2%)
Spread and O/U combined: 118-100 (54.1%)
Picking the winner, I'm ahead by 1.4% when at least 60% confidence, 6.4% when at least 70% confidence. Spread, I'm ahead by 12.7%. O/U, up by 10.5%. Combined, I'm up by 10.6%. That's what I'm talking about. Not to mention I offer all the picks for free... Spread the word everyone.
In tabular format:
Graphically:
Theoretically, as in, if NFLSim was a perfect analog of reality, those dashed lines would be perfectly in line with the thick black line. It would mean that the confidence values are always spot on and the games end exactly the way they should. If the trend (dashed) lines are below the thick line, the confidence values are not as accurate as reality. The more parallel the thick and trend lines are, the more accurate the changes in confidenc values are, i.e., as confidence increases, the accuracy increases at the correct rate. If that makes any sense. This graph shows all the picks.
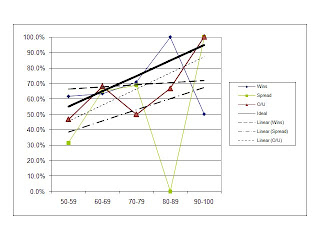
You'll notice that above, the win % for 90-100 is at 50%. In week 3, the 90.03% favorite NE lost to MIA. 0.03% is just about a difference of 1 game in the entire set of hundreds and hundreds of simulated games. Had NE been an 89.97% favorite, the graph would look like this:
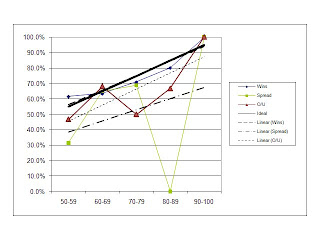
Check out the 'Wins' line. The Wins line overlaps the theoretical line. You can't even see it. That's absolutely absurd, especially after 100 games. The trendline has a slope of .09, compared to the theoretical line's .1. The "Wins" trendline has an R-squared value (a measure of how closely the data points fit the line) of 0.89. Absolutely insane. In general, I try to temper my enthusiasm, but this is unbelievable... This means that when NFLSim says a team will win 63% of the time, that team will win 63% of the time. For those of you math-minded people, the expected number of wins is approximately 64.15. The actual number of wins is 65. That blows my mind.
Here's a team-by-team accuracy breakdown:
I'll post some more stats if I have a chance.
Enjoy!
I'd love to hear everyone's reactions and questions, so don't be shy, send me some emails.
I'm going to give you several different numbers. First, I'll give you the overall numbers, as in the collective 50-100% predictions for winner, spread, and o/u. Then you'll get their numbers broken down. I'll show you weekly trends, % trends, etc.
Overall numbers:
Winner: 65-34 (65.7%)
Spread: 47-45 (51.5%)
O/U: 50-43 (53.8%)
Spread and O/U combined: 97-88 (53.8%)
Accuscore numbers:
Winner: 87-43 (66.9%)
Spread: 51-50 (50.5%)
O/U: 67-50 (57.2%)
Spread and O/U combined: 118-100 (54.1%)
Accuscore has a slight edge when picking the winner, I have a slight edge picking ATS, and Accuscore has a sizeable advantage picking O/U. BUT! Let's look at how Black Box Sports picks compare when confidence is at least 60%. This confidence is really where NFLSim shines. Here is Black Box Sports's record when the confidence is over 60% compared to Accuscore's overall record (can't find any confidence values for picks). Fasten your seat belts.
Black Box Sports +60%:
Winner: 41-19 (68.3%) ... 22-8 (73.3%) when greater than 70%
Spread: 36-21 (63.2%)
O/U: 21-10 (67.7%)
Spread and O/U: 57-31 (64.7%)
Betting 100 units on the spread and over/under, you made +2290, ROI of 26%, halfway through the season.
Once again, Accuscore's numbers:
Accuscore:
Winner: 87-43 (66.9%)
Spread: 51-50 (50.5%)
O/U: 67-50 (57.2%)
Spread and O/U combined: 118-100 (54.1%)
Picking the winner, I'm ahead by 1.4% when at least 60% confidence, 6.4% when at least 70% confidence. Spread, I'm ahead by 12.7%. O/U, up by 10.5%. Combined, I'm up by 10.6%. That's what I'm talking about. Not to mention I offer all the picks for free... Spread the word everyone.
In tabular format:
| Winner | Wins | Games | Win % | |
| 50-59 | 24 | 39 | 61.5% | |
| 60-69 | 19 | 30 | 63.3% | |
| 70-79 | 17 | 24 | 70.8% | |
| 80-89 | 4 | 4 | 100.0% | |
| 90-100 | 1 | 2 | 50.0% | |
| Total | 65 | 99 | 65.7% | |
| Spread | Wins | Games | Win % | |
| 50-59 | 11 | 35 | 31.4% | |
| 60-69 | 24 | 37 | 64.9% | |
| 70-79 | 11 | 16 | 68.8% | |
| 80-89 | 0 | 3 | 0.0% | |
| 90-100 | 1 | 1 | 100.0% | |
| Total | 47 | 92 | 51.1% | |
| Over | Wins | Games | Win % | |
| 50-59 | 29 | 62 | 46.8% | |
| 60-69 | 15 | 22 | 68.2% | |
| 70-79 | 2 | 4 | 50.0% | |
| 80-89 | 2 | 3 | 66.7% | |
| 90-100 | 2 | 2 | 100.0% | |
| Total | 50 | 93 | 53.8% |
S&O/U | ||||
| 50-59 | 40 | 97 | 41.2% | |
| 60-69 | 39 | 59 | 66.1% | |
| 70-79 | 13 | 20 | 65.0% | |
| 80-89 | 2 | 6 | 33.3% | |
| 90-100 | 3 | 3 | 100.0% | |
| Total | 97 | 185 | 52.4% |
Graphically:
Theoretically, as in, if NFLSim was a perfect analog of reality, those dashed lines would be perfectly in line with the thick black line. It would mean that the confidence values are always spot on and the games end exactly the way they should. If the trend (dashed) lines are below the thick line, the confidence values are not as accurate as reality. The more parallel the thick and trend lines are, the more accurate the changes in confidenc values are, i.e., as confidence increases, the accuracy increases at the correct rate. If that makes any sense. This graph shows all the picks.

You'll notice that above, the win % for 90-100 is at 50%. In week 3, the 90.03% favorite NE lost to MIA. 0.03% is just about a difference of 1 game in the entire set of hundreds and hundreds of simulated games. Had NE been an 89.97% favorite, the graph would look like this:

Check out the 'Wins' line. The Wins line overlaps the theoretical line. You can't even see it. That's absolutely absurd, especially after 100 games. The trendline has a slope of .09, compared to the theoretical line's .1. The "Wins" trendline has an R-squared value (a measure of how closely the data points fit the line) of 0.89. Absolutely insane. In general, I try to temper my enthusiasm, but this is unbelievable... This means that when NFLSim says a team will win 63% of the time, that team will win 63% of the time. For those of you math-minded people, the expected number of wins is approximately 64.15. The actual number of wins is 65. That blows my mind.
Here's a team-by-team accuracy breakdown:
| Win % | Cover Spread % | Over % | |
| ARI | 83.3% | 40.0% | 50.0% |
| ATL | 66.7% | 50.0% | 33.3% |
| BAL | 57.1% | 42.9% | 71.4% |
| BUF | 66.7% | 50.0% | 66.7% |
| CAR | 83.3% | 40.0% | 50.0% |
| CHI | 50.0% | 50.0% | 66.7% |
| CIN | 71.4% | 71.4% | 33.3% |
| CLE | 42.9% | 42.9% | 57.1% |
| DAL | 57.1% | 57.1% | 57.1% |
| DEN | 50.0% | 33.3% | 20.0% |
| DET | 100.0% | 66.7% | 40.0% |
| GB | 100.0% | 66.7% | 66.7% |
| HOU | 71.4% | 57.1% | 85.7% |
| IND | 33.3% | 50.0% | 33.3% |
| JAX | 33.3% | 66.7% | 60.0% |
| KC | 83.3% | 66.7% | 83.3% |
| MIA | 33.3% | 66.7% | 50.0% |
| MIN | 83.3% | 66.7% | 50.0% |
| NE | 33.3% | 20.0% | 20.0% |
| NO | 66.7% | 33.3% | 50.0% |
| NYG | 66.7% | 16.7% | 20.0% |
| NYJ | 71.4% | 57.1% | 57.1% |
| OAK | 57.1% | 14.3% | 57.1% |
| PHI | 66.7% | 0.0% | 66.7% |
| PIT | 50.0% | 66.7% | 66.7% |
| SD | 83.3% | 50.0% | 33.3% |
| SEA | 83.3% | 50.0% | 33.3% |
| SF | 50.0% | 33.3% | 40.0% |
| STL | 57.1% | 50.0% | 28.6% |
| TB | 71.4% | 42.9% | 57.1% |
| TEN | 100.0% | 66.7% | 83.3% |
| WAS | 42.9% | 28.6% | 33.3% |
I'll post some more stats if I have a chance.
Enjoy!
I'd love to hear everyone's reactions and questions, so don't be shy, send me some emails.
Friday, October 24, 2008
Week 8: Predictions
Sorry about the delay, folks. Only 3 upsets this week: MIA, NO, and TB. The biggest favorite is TEN over IND (79%), closely followed by HOU over CIN (78%). There are lots of overs and very few teams cover the spread. Still unsure about the Dallas game. For some reason, Vegas has them as a favorite, but the way they played last week, I don't know...
ARI at CAR -4, 43.5
Winner: CAR, 57%
Spread: ARI +4, 59%
O/U: OVER, 51%
ATL at PHI -9, 45
Winner: PHI, 75%
Spread: ATL +9, 51%
O/U: OVER, 58%
BUF -1.5 at MIA, 42
Winner: MIA, 54%
Spread: MIA +1.5, 54%
O/U: OVER, 60%
KC at NYJ -13.5, 39
Winner: NYJ, 72%
Spread: KC +13.5, 64%
O/U: OVER, 71%
OAK at BAL -7.5, 36
Winner: BAL, 65%
Spread: OAK +7.5, 59%
O/U: OVER, 55%
SD -3 at NO, 46
Winner: NO, 54%
Spread: NO +3, 64%
O/U: UNDER, 55%
STL at NE -7, 43.5
Winner: NE, 67%
Spread: STL +7, 59%
O/U: OVER, 56%
TB at DAL -1.5, 40.5
Winner: TB, 68%
Spread: TB +1.5, 70%
O/U: UNDER, 52%
WAS -7.5 at DET, 42
Winner: WAS, 69%
Spread: DET +7.5, 52%
O/U: OVER, 62%
CIN at HOU -9, 44.5
Winner: HOU, 78%
Spread: HOU -9, 56%
O/U: OVER, 57%
CLE at JAX -7, 42
Winner: JAX, 60%
Spread: CLE +7, 66%
O/U: UNDER, 52%
NYG at PIT -3, 42
Winner: PIT, 56%
Spread: NYG +3, 55%
O/U: OVER, 57%
SEA at SF -5, 41
Winner: SF, 60%
Spread: SEA +5, 56%
O/U: OVER, 52%
IND at TEN -4, 41
Winner: TEN, 79%
Spread: TEN -4, 69%
O/U: OVER, 51%
Tuesday, October 21, 2008
Week 7: Results
I'm happy with this week's straight pick results. Hit 2 out of 4 upsets. Hit 10 out of 14 total (71.4%). The picks that lost had confidences of 51, 52, 53, and 67%. I can live with that. I'm very happy with the result of the Dallas - St. Louis game. My injury adjuster worked very well. In fact, the average simulated scores actually had STL outscoring DAL 21.79 to 21.02. That was one of the rare times that the average scores disagree with the win %.
These occurrences include: Week 7, MIN 52% (Correct), CHI 20.29 to MIN 20.13; Week 6, GB 54% (Correct), GB 24.95 to SEA 25.05. So when confidence and average point differentials disagree, confidence is 2-1.
It's also encouraging that as confidence % increases, accuracy increases. The progressive results are looking good. After the half-way point of the season, I'll write up a detailed report.
BOA had a great week, up 91%, further proving the volatility which I'm not comfortable with.
By the way, if I ever make any mistakes, let me know so I can fix it.
BAL at MIA -3, 36.5
Winner: MIA, 67%
Spread: MIA -3, 56%
O/U: OVER, 60%
DAL -7 at STL, 43.5
Winner: DAL, 51%
Spread: STL +7, 74%
O/U: UNDER, 52%
MIN at CHI -3, 38
Winner: MIN, 52%
Spread: MIN +3, 59%
O/U: OVER, 54%
NO at CAR -3, 44.5
Winner: CAR, 53%
Spread: NO +3, 59%
O/U: UNDER, 62%
PIT -9.5 at CIN, 35
Winner: PIT, 60%
Spread: CIN +9.5, 63%
O/U: OVER, 62%
SD at BUF EVEN, 44.5
Winner: BUF, 64%
Spread: BUF, 64%
O/U: OVER, 55%
SF at NYG -10.5, 46
Winner: NYG, 67%
Spread: SF +10.5, 68%
O/U: UNDER, 53%
TEN -9 at KC, 35.5
Winner: TEN, 69%
Spread: KC +9, 61%
O/U: OVER, 66%
DET at HOU -9.5, 46.5
Winner: HOU, 82%
Spread: HOU -9.5, 59%
O/U: OVER, 58%
CLE at WAS -7, 42
Winner: WAS, 77%
Spread: WAS -7, 55%
O/U: OVER, 53%
IND -2 at GB, 47
Winner: GB, 60%
Spread: GB +2, 65%
O/U: UNDER, 53%
NYJ -3 at OAK, 41
Winner: OAK, 55%
Spread: OAK +3, 65%
O/U: OVER, 63%
SEA at TB -10.5, 38
Winner: TB, 69%
Spread: SEA +10.5, 59%
O/U: OVER, 63%
DEN at NE -3, 48
Winner: DEN, 53%
Spread: DEN +3, 63%
O/U: OVER, 53%
| Straight | % | Wins | Games | Win % |
| 50-59 | 2 | 5 | 40.0% | |
| 60-69 | 6 | 7 | 85.7% | |
| 70-79 | 1 | 1 | 100.0% | |
| 80-89 | 1 | 1 | 100.0% | |
| 90-100 | 0 | 0 | ||
| Total | 10 | 14 | 71.4% | |
| Spread | % | Wins | Games | Win % |
| 50-59 | 1 | 6 | 16.7% | |
| 60-69 | 4 | 7 | 57.1% | |
| 70-79 | 1 | 1 | 100.0% | |
| 80-89 | 0 | 0 | ||
| 90-100 | 0 | 0 | ||
| Total | 6 | 14 | 42.9% | |
| Total | Wins | Games | Win % | |
| 50-59 | 2 | 6 | 33.3% | |
| 60-69 | 4 | 6 | 66.7% | |
| 70-79 | 0 | 0 | ||
| 80-89 | 0 | 0 | ||
| 90-100 | 0 | 0 | ||
| Total | 6 | 12 | 50.0% |
Wednesday, October 15, 2008
Week 6: Results
Week 6 was an OK week. 2-3 with upsets, hitting ATL and GB. Not happy about MIA's loss. And CLE over NYG? Arguably the worst team in the NFL upsetting arguably the best team in the NFL. Any given Monday night... The win % and O/U % were a little disappointing, but can't complain about 57% spread.
BAL at IND -5, 39
Winner: BAL, 58%
Spread: BAL +5, 72%
O/U: OVER, 51%
CAR at TB -1, 36.5
Winner: TB, 58%
Spread: TB -1, 56%
O/U: OVER, 69%
CHI -3 at ATL, 43.5
Winner: ATL, 57%
Spread: ATL +3, 67%
O/U: OVER, 58%
CIN at NYJ -6, 44.5
Winner: NYJ, 65%
Spread: CIN +6, 51%
O/U: OVER, 56%
DET at MIN -14, 45.5
Winner: MIN, 79%
Spread: DET +14, 61%
O/U: OVER, 59%
MIA at HOU -3, 44.5
Winner: MIA, 51%
Spread: MIA +3, 66%
O/U: OVER, 70%
OAK at NO -7.5, 47
Winner: OAK, 55%
Spread: OAK +7.5, 80%
O/U: UNDER, 57%
STL at WAS -13.5, 44.5
Winner: WAS, 76%
Spread: STL +13.5, 63%
O/U: OVER, 54%
JAX at DEN -3.5, 48
Winner: DEN, 75%
Spread: DEN -3.5, 63%
O/U: OVER, 57%
DAL -6 at ARI, 50
Winner: DAL, 51%
Spread: ARI +6, 70%
O/U: UNDER, 54%
GB at SEA -3, 47
Winner: GB, 54%
Spread: GB +3, 60%
O/U: OVER, 57%
PHI -5 at SF, 43
Winner: PHI, 59%
Spread: SF +5, 52%
O/U: OVER, 58%
NE at SD -6, 45
Winner: SD, 60%
Spread: NE +6, 59%
O/U: OVER, 72%
NYG -8 at CLE, 43
Winner: NYG, 76%
Spread: NYG -8, 51%
O/U: OVER, 55%
| Straight | % | Wins | Games | Win % |
| 50-59 | 4 | 8 | 50.0% | |
| 60-69 | 2 | 2 | 100.0% | |
| 70-79 | 1 | 4 | 25.0% | |
| 80-89 | 0 | 0 | --- | |
| 90-100 | 0 | 0 | --- | |
| Total | 7 | 14 | 50.0% | |
| Spread | % | Wins | Games | Win % |
| 50-59 | 2 | 5 | 40.0% | |
| 60-69 | 5 | 6 | 83.3% | |
| 70-79 | 1 | 2 | 50.0% | |
| 80-89 | 0 | 1 | 0.0% | |
| 90-100 | 0 | 0 | --- | |
| Total | 8 | 14 | 57.1% | |
| Total | Wins | Games | Win % | |
| 50-59 | 3 | 11 | 27.3% | |
| 60-69 | 0 | 1 | 0.0% | |
| 70-79 | 1 | 2 | 50.0% | |
| 80-89 | 0 | 0 | --- | |
| 90-100 | 0 | 0 | --- | |
| Total | 4 | 14 | 28.6% |
Friday, October 10, 2008
Week 6: Top 5 / Bottom 5
(The game predictions are below this post)
Let's have a little fun this week.
The top 5 QB's by rating will be:
1. Aaron Rodgers, GB: 109.3
2. Jason Campbell, WAS: 109.2
3. Chad Pennington, MIA: 105.7
4. Jay Cutler, DEN: 104.0
5. Gus Frerotte, MIN: 103.4
Botom 5:
28. Jeff Garcia (in for Griese), TB: 83.0
29. Dan Orlovsky (in for Kitna), DET: 82.0
30. Derek Anderson, CLE: 75.4
31. Peyton Manning, IND: 73.1
32. Charlie Frye (in for Hasselbeck), SEA: 71.5
Top 5 teams by rushing yards:
1. Washington Redskins: 178.3
2. Atlanta Falcons: 171.8
3. Baltimore Ravens: 165.3
4. Oakland Raiders: 160.8
5. Seattle Seahawks: 160.6
Bottom 5:
28. Philadelphia Eagles: 75.3
29. New Orleans Saints: 72.7
30. Cincinnati Bengals: 63.4
31. Indianapolis Colts: 47.4
32. Detroit Lions: 46.5
Top 5 offenses by Points Scored:
1. Minnesota Vikings: 30.8
2. Denver Broncos: 30.2
3. San Diego Chargers: 29.0
4. Washington Redskins: 27.6
5. New York Giants: 27.5
Bottom 5:
28. Carolina Panthers: 19.8
29. Detroit Lions: 18.8
30. Indianapolis Colts: 18.4
31. St. Louis Rams: 18.4
32. Cleveland Browns: 17.8
Top 5 Defenses by Yards Allowed:
1. New York Giants: 229.7
2. Baltimore Ravens: 234.4
3. New York Jets: 260.6
4. Minnesota Vikings: 278.4
5. Washington Redskins: 280.2
Bottom 5:
28. Seattle Seahawks: 350.5
29. Detroit Lions: 355.6
30. Denver Broncos: 357.5
31. Houston Texans: 367.0
32. St. Louis Rams: 395.0
That's enough for now. Any opinions?
Tuesday, October 7, 2008
Week 5: Results
I'm happy with this week's performance. Picked 9 out of 14, beat Accuscore's 8 of 14. Also, out of the 5 underdogs NFLSim picked to win, 3 of them won (ATL, 3.5 pt dog; PIT, 4; MIN, 3).
Tie is Blue
SEA at NYG -7, 43.5
Winner: NYG, 70%
Spread: SEA +7, 56%
O/U: UNDER, 55%
WAS at PHI -6, 42.5
Winner: PHI, 73%
Spread: PHI -6, 51%
O/U: UNDER, 56%
SD -6.5 at MIA, 44.5
Winner: SD, 54%
Spread: MIA +6.5, 67%
O/U: OVER, 72%
KC at CAR -9.5, 38.5
Winner: CAR, 61%
Spread: KC +9.5, 68%
O/U: UNDER, 54%
TEN -3 at BAL, 33
Winner: TEN, 51%
Spread: BAL +3, 62%
O/U: OVER, 55%
IND -3.5 at HOU, 47
Winner: HOU, 63%
Spread: HOU +3.5, 68%
O/U: OVER, 56%
CHI -3.5 at DET, 44.5
Winner: CHI, 73%
Spread: CHI -3.5, 64%
O/U: OVER, 57%
ATL at GB -3.5, 41
Winner: ATL, 67%
Spread: ATL +3.5, 74%
O/U: OVER, 64%
TB at DEN -3, 47.5
Winner: DEN, 55%
Spread: TB +3, 55%
O/U: OVER, 56%
CIN at DAL -17, 44
Winner: DAL, 73%
Spread: CIN +17, 72%
O/U: OVER, 51%
BUF at ARI EVEN, 44.5
Winner: BUF, 74%
Spread: ---
O/U: OVER, 51%
NE -3.5 at SF, 41
Winner: SF, 54%
Spread: SF +3.5, 67%
O/U: UNDER, 51%
PIT at JAX -4, 36
Winner: PIT, 61%
Spread: PIT +4, 72%
O/U: OVER, 62%
MIN at NO -3, 46.5
Winner: MIN, 52%
Spread: MIN +3, 60%
O/U: UNDER, 58%
| Straight | % | Correct | Games | Win % |
| 50-59 | 3 | 5 | 60.0% | |
| 60-69 | 3 | 4 | 75.0% | |
| 70-79 | 3 | 5 | 60.0% | |
| 80-89 | 0 | 0 | --- | |
| 90-100 | 0 | 0 | --- | |
| Total | 9 | 14 | 64.3% | |
| Spread | % | Correct | Games | Win % |
| 50-59 | 0 | 3 | 0.0% | |
| 60-69 | 3 | 6 | 50.0% | |
| 70-79 | 3 | 3 | 100.0% | |
| 80-89 | 0 | 0 | --- | |
| 90-100 | 0 | 0 | --- | |
| Total | 6 | 12 | 50.0% | |
| Total | Correct | Games | Win % | |
| 50-59 | 5 | 11 | 45.5% | |
| 60-69 | 2 | 2 | 100.0% | |
| 70-79 | 0 | 1 | 0.0% | |
| 80-89 | 0 | 0 | --- | |
| 90-100 | 0 | 0 | --- | |
| Total | 7 | 14 | 50.0% |
Thursday, September 18, 2008
Week 2 Analysis
I'm not gonna lie, week 2 didn't go too well. Though that's not so surprising considering the nature of simulations - accuracy increases as the amount of data increases. Win = Green, Loss = Red, Push = Blue.
NYG -8.5 at STL
Winner: NYG, 76%
Spread: EVEN
IND -2 at MIN
Winner: MIN, 54%
Spread: MIN +2, 58%
NO -1 at WAS
Winner: NO, 61%
Spread: NO -1, 60%
CHI at CAR -3
Winner: CAR, 51%
Spread: CHI +3, 61%
BUF at JAX -5
Winner: BUF, 64%
Spread: BUF +5, 77%
TEN at CIN -1
Winner: TEN, 79%
Spread: TEN +1, 80%
GB -3.5 at DET
Winner: DET, 59%
Spread: DET +3.5, 64%
OAK at KC -3.5
Winner: KC, 81%
Spread: KC -3.5, 72%
SF at SEA -6.5
Winner: SF, 79%
Spread: SF +6.5, 89%
ATL at TB -7
Winner: ATL, 80%
Spread: ATL +7, 92%
SD -1 at DEN
Winner: DEN, 74%
Spread: DEN +1, 75%
BAL at HOU -4.5
Winner: BAL, 70%
Spread: BAL +4.5, 80%
NE at NYJ -1.5
Winner: NYJ, 53%
Spread: EVEN
MIA at ARI -6.5
Winner: ARI, 57%
Spread: MIA +6.5, 61%
PIT -6 at CLE
Winner: PIT, 91%
Spread: PIT -6, 79%
PHI at DAL -7
Winner: PHI, 65%
Spread: PHI +7, 84%
| Straight | % | Wins | Games | Win % |
| 50-59 | 2 | 5 | 40.0% | |
| 60-69 | 1 | 3 | 33.3% | |
| 70-79 | 4 | 4 | 100.0% | |
| 80-89 | 0 | 2 | 0.0% | |
| 90-100 | 1 | 1 | 100.0% | |
| Total | 8 | 15 | 53.3% | |
| Spread | % | Wins | Games | Win % |
| 50-59 | 0 | 1 | 0.0% | |
| 60-69 | 0 | 3 | 0.0% | |
| 70-79 | 2 | 4 | 50.0% | |
| 80-89 | 2 | 3 | 66.7% | |
| 90-100 | 0 | 1 | 0.0% | |
| Total | 4 | 12 | 33.3% |
Friday, September 12, 2008
Prediction Primer
Before I start putting up the picks, I'll write a quick little blurb about what I'll be posting and how to interpret all of the info. A game's prediction will look like the following:
AWAY at HOME, TOTAL
Winner: PICK, %
Spread: PICK, %
Total: PICK, %
NYG -8.5 at STL, 41.5
Winner: NYG, 76%
Spread: NYG -8.5, 50%
Total: OVER, 66%
So that means: The Giants are an 8.5 pt favorite playing in St. Louis. The over/under line is 41.5. NYG wins outright in 76% of the simulations (380 of 500 simulations). NYG covers the 8.5 point spread in half the simulations. The total score exceeds 41.5 points in 66% of simulations. Simple enough, yes?
Last season, it turned out that the confidence when picking winners actually matched the real life probability of that team winning. (One of the first blog entries has more info on that.) If I simulated 100 different match-ups over the course of the season and they all had a confidence of 65%, in reality, 65 of those 100 picks would be correct. That's extremely useful for gambling purposes, so hopefully that correlation will continue, though there are no guarantees.
I'll also be posting weekly offensive, defensive, and overall power rankings and ratings based on my simulations.
I combined the Kelly criterion with some of my own calculations to determine the optimal bets based on the payout of the bet and the confidence of the pick. Check out en.wikipedia.org/wiki/Kelly_criterion for more info. I'll post the results of the calculations as betting suggestions.
I got a request to post some stats from the simulation, so I'll put those up as well.
Any questions/comments, feel free to shoot me an email.
Wednesday, August 27, 2008
Simulating Teams vs. Simulating Players
Due to popular demand, I'll be writing a weekly article about various aspects of model building, money management strategy, or whatever questions anyone has. So if you're curious about something specific, speak up. This first article deals with the difference between simulating games using a team model versus an individual player model.
"Keep it simple, stupid" - Confucius
One of the most important decisions to make when simulating a sport is whether to simulate a game using team stats or to break it down further and use individual player stats. A convincing argument can be made for either method. If you've read anything about NFLSim's background, you know that the simulation uses team stats and not player stats. Here's a comparison of the two methods, in a football context:
Keep in mind that this is just one way to build a model; if you're building your own, use whatever method fits you.
1) From the viewpoint of a novice programmer, using team stats is really easy. There are a dozen different websites with consolidated, uniform, and sortable information. www.nfl.com and www.espn.com for example. Once you've acquired the data, you can easily manipulate it into the form that works for your program. The team stats can be incorporated into the simulation from a single web page. Grabbing an individual's stats takes a little more effort and problem solving. The difficulty lies in the automation of the process. Getting the program to find each team's website then find the player specific data you're looking for, can be tricky.
It doesn't sound much more difficult, but if you decide to use player statistics, you'll have to really work on your organizational skills. Remember, you'll have to retrieve and organize data from every position (with backups and second strings, etc.) from every team, i.e. DAL: QB Tony Romo, Brad Johnson, Richard Bartel; RB Marion Barber, Felix Jones, Tony Romo; WR .... .... .... You get the idea. All of this extra information that you use means you need a lot more computing power and a lot more patience.
2) Injuries? Substitutions? Trades? Here is where it may seem that simulation at the player level has an advantage over simulation at the team level. Surely when you account for individual changes, you'll get better accuracy, right? Well...maybe. Let's talk about team stats first. Team stats, at the very basic level do not take into account injuries, substitutions, trades or anything of the sort. Team simulations operate under the assumption that the team is a single, static object, which generates stats as the weeks go by, regardless of the players that make it up. From a programming standpoint, this makes things really easy because you don't have to worry about writing code to distinguish between different players and their respective stats, you just use a single set of statistics for the entire simulation.
From the player perspective: by accounting for major changes, you might be able to improve your accuracy. How do you reconcile in-game changes? The Cowboys consistently used Julius Jones and Marion Barber in the same game, so you have to figure out who runs each play in the simulation. The best method I can think of is finding how many attempts per game each RB has and proportion the plays in the simulation accordingly. When you consider every player for every team, this becomes pretty daunting.
Now let's assume there's an injury. If the Patriots have built up a set of passing statistics with Brady as the QB, those statistics are going to be pretty damn good, and they'll carry through to the next games. After 14 weeks, Brady gets injured and is out for the season. This is where a player simulation has its advantage; by using the great team stats that the Patriots had generated to simulate the subsequent games, you misrepresent the Patriots' skill as being greater than it actually is. Therefore, the next games will be inaccurate. When you use replace Brady with his backup, everything might work out. The tricky part is assigning averages or attributes to a player with no experience. You can figure out for yourself. Other provisions can be made when using team's stats if an injury occurs, like a assigning a general injury multiplier to the affected statistics. Trades can be treated in the same manner as injuries; both a player swap.
When deciding whether to write a simulation using team statistics or player statistics, the important factors to consider are: programming ability, patience, and free time. If you're an expert programmer with experience integrating web data with your respective programming language or if you've got a real drive to get the program done, consider using player stats. Otherwise, use team stats.
If you're wondering about how team accuracy compares with player accuracy, compare Black Box Sports and Accuscore. Black Box Sports' NFLSim uses team statistics for play-by-play simulations, Accuscore assigns attributes to individual players for their play-by-play simulation. This is the first full season for Black Box Sports, so we'll see who wins.
Saturday, March 29, 2008
Results through week 7
Yes, I'm only at week 7. I'm putting NFLSim away for a couple weeks to focus on basketball... nbablackbox.blogspot.com, where I'm 204-51 (80.0%), when picking the winner of the game. (no spread). 178-123(59.1%) with the spread. But just like football, when you're picking with that kind of accuracy, you can make money with the moneyline. Soccer is also in the works, and the backtest results are very, very promising; a sport where the only main bet is 'who will win'. Perfect. Don't think I've forgotten about baseball! Once enough stats have accumulated I'll try my hardest to do better than the 1000's of guys who've come before me. And you can bet that I will! (pun intended)
Since there are so many numbers, I'm going to skip the details and just post the main stats. If you want the details...I don't know why you would... just send me an email. This is for weeks 2-7, 87 games in all.
Thats pretty good. Win: 72.4%, Spread: 54%, O/U: 59.8%
Really, it was just one bad week that brought the numbers down, unfortunately bad weeks are unavoidable and if anyone tells you otherwise, they're trying to scam you.
That's it for now. You can find me at nbablackbox.blogspot.com, mlbblackbox.blogspot.com, and soccerblackbox.blogspot.com. The latter 2 are under construction- soccer will feature the main leagues from England, France, Germany, Italy, and Spain. It will be up sooner than MLB, probably sometime this week.
Good luck, all! Be responsible, don't be greedy, and don't get scammed.
Since there are so many numbers, I'm going to skip the details and just post the main stats. If you want the details...I don't know why you would... just send me an email. This is for weeks 2-7, 87 games in all.
| Win | Games | Wins | Win % | |
| 50-59 | 41 | 30 | 73.2% | |
| 60-69 | 22 | 17 | 77.3% | |
| 70-79 | 17 | 10 | 58.8% | |
| 80-89 | 7 | 6 | 85.7% | |
| 90-100 | 0 | 0 | #DIV/0! | |
| Total | 87 | 63 | 72.4% | |
| Spread | Games | Wins | Win % | |
| 50-59 | 35 | 15 | 42.9% | |
| 60-69 | 29 | 18 | 62.1% | |
| 70-79 | 20 | 12 | 60.0% | |
| 80-89 | 3 | 2 | 66.7% | |
| 90-100 | 0 | 0 | #DIV/0! | |
| Total | 87 | 47 | 54.0% | |
| Over | Games | Wins | Win % | |
| 50-59 | 17 | 13 | 76.5% | |
| 60-69 | 26 | 13 | 50.0% | |
| 70-79 | 27 | 15 | 55.6% | |
| 80-89 | 15 | 9 | 60.0% | |
| 90-100 | 2 | 2 | 100.0% | |
| Total | 87 | 52 | 59.8% |
Thats pretty good. Win: 72.4%, Spread: 54%, O/U: 59.8%
Really, it was just one bad week that brought the numbers down, unfortunately bad weeks are unavoidable and if anyone tells you otherwise, they're trying to scam you.
That's it for now. You can find me at nbablackbox.blogspot.com, mlbblackbox.blogspot.com, and soccerblackbox.blogspot.com. The latter 2 are under construction- soccer will feature the main leagues from England, France, Germany, Italy, and Spain. It will be up sooner than MLB, probably sometime this week.
Good luck, all! Be responsible, don't be greedy, and don't get scammed.
Subscribe to:
Posts (Atom)
