
Week 8 Picks, Stats & Fantasy
Week 7 Picks, Stats & Fantasy
Week 6 Picks, Stats & Fantasy
Week 5 Picks, Stats & Fantasy
Week 4 Picks & Stats
Week 3 Picks & Stats
Week 2 Picks & Stats
Week 1 Picks & Stats
---
More picks are up now (10:30am), all will be up by tonight.
---
Almost all of the games are up. Fantasy and stats will be up tonight.
---
Everything is up. Including a donation button on the top right of the blog if you've had some luck with the predictions, if the fantasy projections put you at the top of your league, or if you just want to say thanks.
A match-up analysis to follow...
Showing posts with label Black Box Sports. Show all posts
Showing posts with label Black Box Sports. Show all posts
Wednesday, October 28, 2009
Wednesday, October 7, 2009
Week 5 Picks
Week 5 Picks, Stats & Fantasy
Week 4 Picks & Stats
Week 3 Picks & Stats
Week 2 Picks & Stats
Week 1 Picks & Stats
Sim Capper: Now with Fantasy!
Go to the "Fantasy Projections" sheet to check out how NFLSim ranks the teams based on their fantasy performance. Last week went well. If you're on the fence about a position, check out the rankings and projected points to make up your mind.
***Full stat tables and Fantasy Ranks will go up as soon as all of the games have been simulated***
---
Stats and fantasy are up, Seattle doesn't seem to be in any rush...
NFL.com ranked their QBs pretty much the same as NFLSim, that's pretty cool.
---
***Fixed the Fantasy defense rankings***
---
Watch out for the totals this week, the scores are running a little high.
---
Monday Night Matchup
NYJ -1.5 at MIA, 36.5
I don't care what anyone says, I still like the Dolphins. Both teams are going to have an extremely lackluster passing game with Sanchez and Henne at their helms. Sanchez with an impressive 4 TDs and 5 INTs on the season; Henne with his second start ever. NFLSim has them pretty much even in terms of stats - same attempts, completion percentage, average TDs... The only difference being Sanchez's comparatively impressive 7.4 yds/att compared to Henne's 5.4. Don't look for much in the air, but the Jets should have the advantage. The difference will be the Wildcat offense; Miami dominates in all simulated rushing categories, including a projected 175 yards to New York's 102. That's not too hard to believe, considering last week against Buffalo, Ronnie Brown and (hook 'em) Ricky Williams ran for a combined 250 yards, averaging 5.6 yds/att, with a sexy 3 TDs. Even better, this is an AFC East rivalry, so anything can happen. The Jets are sure to get a boost when they leave that sh*tty NY weather for some awesome south Florida sunshine. Me and NFLSim are still on the Wildcat bandwagon: MIA to win, 63%; MIA cover +1.5, 64%; good chance the score is OVER 36.5, 85%.
Wednesday, September 23, 2009
Week 3 Picks
Week 3 simulations are underway, the picks can be found here:
Week 3 Picks & Stats
Week 2 Picks & Stats
Week 1 Picks & Stats
If you catch me looking at the spreadsheet, feel free to ask a question in that little message box.
***Check out the bottoms of sheets, I'm trying something new and awesome. (Interactive point spread graph!)*** Feedback is welcomed
Monday Night Matchup
Carolina Panthers at Dallas Cowboys -9, 47.5
After last weekend's homecoming embarrassment, the 'Boys aren't going to be to happy when they see the Panthers on that giant monitor. Look for Dallas to have balanced attack, simulations show about 50-50 pass, run plays. Romo is sure to connect for a few big plays and a couple TDs (avg. 1.3 40+ yard plays, 2 TD). Carolina is allowing 168 rush yds per game and that's not going to change this week as the Cowboys run for 178 yds and 1.7 TDs. Carolina has a slight edge in FGs which could be the difference between a CAR +9 and a DAL -9, or a CAR win or DAL win. Last week, NFLSim showed a big FG discrepancy between Dallas and NY and that's how the game was decided. Dallas has a definite overall advantage, Dallas to win 63%, but a late FG might screw things up, Carolina +9, 59%. Update: the point spread analysis found in the spreadsheet backs up my FG theory - Dallas loses by 3 or fewer points in a whopping 10% of simulations.
---
Upset Special
Miami Dolphins over San Diego Chargers -6, 44
This is the biggest upset this week as Miami is a 6 pt dog. The best phrase to describe this game would be "ground and pound". I've never heard that phrase used in football context, but I'm probably just out of the loop. It's a term used in Mixed Martial Arts to describe the technique of pinning your opponent on the ground and beating the hell out of him. I suppose in the case of the Wildcat offense it'll be "ground and maul"... NFLSim says: 34 carries for 150 yards and 1.7 TDs. The key for Miami is to control the clock and in the simulations they own the ball for nearly the longest of all teams this week (second Baltimore). As long as they can keep Rivers off the field, they'll be in good shape. Miami is extremely vulnerable to the deep ball and Rivers is projected to throw 4 balls over 20 yards, 2 TDs and 260 total yards, ouch. If Miami can hold onto the ball and keep the Chargers' passing game in check, they've got nothing to worry about. Miami blew it last week against the Colts by allowing 2 monster passing TDs of 80 and 48 yards. If San Diego can exploit those gaping holes in the secondary, Miami is going to blow it again. Miami to win a slim 59%, Miami beats the 9 point spread 77%.
7/10 Point teasers Record
I just posted this info in a comment but it's too damn good to leave out of a main post. In the comment below, Anon says of teasers, "I know it's a sucker bet. But dammit, I don't care."
Here's my record if you add 7 and 10 points to the spreads for weeks 1 and 2:
Week 1, 7 pt teaser
50-59%: 3-1 (75%)
60-69: 5-1 (71.4%)
70-79: 3-0 (100%)
80-89: 2-0 (100%)
Overall: 13-2 (86.7%)
Week 1, 10 pt teaser
50-59%: 4-0 (100%)
60-69: 6-0 (100%)
70-79: 4-0 (100%)
80-89: 2-0 (100%)
Overall: 16-0 (100%)
(Wow! 16-0)
Week 2, 7 pt teaser
50-59%: 4-2 (66.7%)
60-69: 4-0 (100%)
70-79: 5-0 (100%)
80-89: 1-0 (100%)
Overall: 14-2 (87.5%)
Week 2, 10 pt teaser
50-59%: 4-2 (66.7%)
60-69: 4-0 (100%)
70-79: 5-0 (100%)
80-89: 1-0 (100%)
Overall: 14-2 (87.5%)
Those teasers may not be such a sucker bet after all when NFLSim is doing the picking...
Thanks to Anon for bringing up a betting strategy that many may not have considered. If you've got a strategy of your own that's been working, go ahead and share the love.
---
I added a "Fair Moneyline Odds" column to the predictions sheet of the spreadsheet. If your sports book is offering a payout equal to or greater than the Fair Moneyline Odds for the team shown, it is a good bet. If the payout is less than the Fair Moneyline Odds, the best bet is for the opposing team to win (even if NFLSim picks them to lose). By using the FMO, you're not betting on the team that you think is going to win, you are exploiting an inefficiency in the line.
Week 3 Picks & Stats
Week 2 Picks & Stats
Week 1 Picks & Stats
If you catch me looking at the spreadsheet, feel free to ask a question in that little message box.
***Check out the bottoms of sheets, I'm trying something new and awesome. (Interactive point spread graph!)*** Feedback is welcomed
Monday Night Matchup
Carolina Panthers at Dallas Cowboys -9, 47.5
After last weekend's homecoming embarrassment, the 'Boys aren't going to be to happy when they see the Panthers on that giant monitor. Look for Dallas to have balanced attack, simulations show about 50-50 pass, run plays. Romo is sure to connect for a few big plays and a couple TDs (avg. 1.3 40+ yard plays, 2 TD). Carolina is allowing 168 rush yds per game and that's not going to change this week as the Cowboys run for 178 yds and 1.7 TDs. Carolina has a slight edge in FGs which could be the difference between a CAR +9 and a DAL -9, or a CAR win or DAL win. Last week, NFLSim showed a big FG discrepancy between Dallas and NY and that's how the game was decided. Dallas has a definite overall advantage, Dallas to win 63%, but a late FG might screw things up, Carolina +9, 59%. Update: the point spread analysis found in the spreadsheet backs up my FG theory - Dallas loses by 3 or fewer points in a whopping 10% of simulations.
---
Upset Special
Miami Dolphins over San Diego Chargers -6, 44
This is the biggest upset this week as Miami is a 6 pt dog. The best phrase to describe this game would be "ground and pound". I've never heard that phrase used in football context, but I'm probably just out of the loop. It's a term used in Mixed Martial Arts to describe the technique of pinning your opponent on the ground and beating the hell out of him. I suppose in the case of the Wildcat offense it'll be "ground and maul"... NFLSim says: 34 carries for 150 yards and 1.7 TDs. The key for Miami is to control the clock and in the simulations they own the ball for nearly the longest of all teams this week (second Baltimore). As long as they can keep Rivers off the field, they'll be in good shape. Miami is extremely vulnerable to the deep ball and Rivers is projected to throw 4 balls over 20 yards, 2 TDs and 260 total yards, ouch. If Miami can hold onto the ball and keep the Chargers' passing game in check, they've got nothing to worry about. Miami blew it last week against the Colts by allowing 2 monster passing TDs of 80 and 48 yards. If San Diego can exploit those gaping holes in the secondary, Miami is going to blow it again. Miami to win a slim 59%, Miami beats the 9 point spread 77%.
7/10 Point teasers Record
I just posted this info in a comment but it's too damn good to leave out of a main post. In the comment below, Anon says of teasers, "I know it's a sucker bet. But dammit, I don't care."
Here's my record if you add 7 and 10 points to the spreads for weeks 1 and 2:
50-59%: 3-1 (75%)
60-69: 5-1 (71.4%)
70-79: 3-0 (100%)
80-89: 2-0 (100%)
Overall: 13-2 (86.7%)
Week 1, 10 pt teaser
50-59%: 4-0 (100%)
60-69: 6-0 (100%)
70-79: 4-0 (100%)
80-89: 2-0 (100%)
Overall: 16-0 (100%)
(Wow! 16-0)
Week 2, 7 pt teaser
50-59%: 4-2 (66.7%)
60-69: 4-0 (100%)
70-79: 5-0 (100%)
80-89: 1-0 (100%)
Overall: 14-2 (87.5%)
Week 2, 10 pt teaser
50-59%: 4-2 (66.7%)
60-69: 4-0 (100%)
70-79: 5-0 (100%)
80-89: 1-0 (100%)
Overall: 14-2 (87.5%)
Those teasers may not be such a sucker bet after all when NFLSim is doing the picking...
Thanks to Anon for bringing up a betting strategy that many may not have considered. If you've got a strategy of your own that's been working, go ahead and share the love.
---
I added a "Fair Moneyline Odds" column to the predictions sheet of the spreadsheet. If your sports book is offering a payout equal to or greater than the Fair Moneyline Odds for the team shown, it is a good bet. If the payout is less than the Fair Moneyline Odds, the best bet is for the opposing team to win (even if NFLSim picks them to lose). By using the FMO, you're not betting on the team that you think is going to win, you are exploiting an inefficiency in the line.
Tuesday, September 22, 2009
Week 2 Results
NFLSim had another great week- even greater because it was only the second week of the season. Straight up picks went 9-7 (56.3%) overall. On the surface that's pretty disappointing, but check out how those wins are distributed within the confidence intervals. 50% confidence picks went 5-4 (55.6%) and 60% confidence picks went 3-2 (60%). Missed the 70% game (MIA over IND), that goes down as the most disappointing game of the week :(. The 80% game, DEN over CLE went pretty well.
The picks against the spread had another amazing week. Mia +4 was a tie so I left it out. Overall ATS went 10-5 (66.7%). 50% confidence games went 3-3 (50%), 60% confidence games went 3-1 (75%), 70% confidence games went 4-1 (80%). Come on. You can't argue with that.
That being said, O/U picks were a total debacle at 5-10 (33.3%). NFLSim was 50-50 on the PHI-NO O/U.
More analysis under the numbers...
Best game of the week: HOU +7 to win straight up against TEN at 54%... there's a moneymaker.
Runner up: NYJ +4 to win straight up against NE at 67%... take THAT Brady.
Game I cried after: IND at MIA... I wanted it as much for Miami as I wanted it for me.
The game that no one saw coming: CIN beat GB... huh?
Worst pick of the week: JAX -3.5 ...
Last week's 'CLE at DEN' analysis predicted a fairly even match up with the expectation that DEN would take control on the ground and in the red zone. Buckhalter and Moreno took 76 and 75 yards a piece, with a TD for Buckhalter. Denver went 2-4 in the red zone w/ 2 TDs, Cleveland went 0-1. Denver dominated the air for most of the game.
Stay tuned for more predictions, more analyses, and more surprises next week!
The picks against the spread had another amazing week. Mia +4 was a tie so I left it out. Overall ATS went 10-5 (66.7%). 50% confidence games went 3-3 (50%), 60% confidence games went 3-1 (75%), 70% confidence games went 4-1 (80%). Come on. You can't argue with that.
That being said, O/U picks were a total debacle at 5-10 (33.3%). NFLSim was 50-50 on the PHI-NO O/U.
More analysis under the numbers...
| STRAIGHT UP | |||
| CONFIDENCE | GAMES | CORRECT | % CORRECT |
| 50-59 | 9 | 5 | 55.56% |
| 60-69 | 5 | 3 | 60.00% |
| 70-79 | 1 | 0 | 0.00% |
| 80-89 | 1 | 1 | 100.00% |
| 90-100 | 0 | 0 | --- |
| TOTAL | 16 | 9 | 56.25% |
| ATS | |||
| CONFIDENCE | GAMES | CORRECT | % CORRECT |
| 50-59 | 6 | 3 | 50.00% |
| 60-69 | 4 | 3 | 75.00% |
| 70-79 | 5 | 4 | 80.00% |
| 80-89 | 0 | 0 | --- |
| 90-100 | 0 | 0 | --- |
| TOTAL | 15 | 10 | 66.67% |
| O/U | |||
| CONFIDENCE | GAMES | CORRECT | % CORRECT |
| 50-59 | 9 | 4 | 44.44% |
| 60-69 | 5 | 1 | 20.00% |
| 70-79 | 1 | 0 | 0.00% |
| 80-89 | 0 | 0 | --- |
| 90-100 | 0 | 0 | --- |
| TOTAL | 15 | 5 | 33.33% |
Best game of the week: HOU +7 to win straight up against TEN at 54%... there's a moneymaker.
Runner up: NYJ +4 to win straight up against NE at 67%... take THAT Brady.
Game I cried after: IND at MIA... I wanted it as much for Miami as I wanted it for me.
The game that no one saw coming: CIN beat GB... huh?
Worst pick of the week: JAX -3.5 ...
Last week's 'CLE at DEN' analysis predicted a fairly even match up with the expectation that DEN would take control on the ground and in the red zone. Buckhalter and Moreno took 76 and 75 yards a piece, with a TD for Buckhalter. Denver went 2-4 in the red zone w/ 2 TDs, Cleveland went 0-1. Denver dominated the air for most of the game.
Stay tuned for more predictions, more analyses, and more surprises next week!
Tuesday, September 15, 2009
Week 2 Picks
Got an early start this week. This week's spreadsheet can be found at...
Week 2 Picks & Stats
Week 1 Picks & Stats
I add games as the week goes by, so keep checking back!
During the course of the week, if the line changes by at least 1 point I'll redo the sim. Anything less than that only changes the % by 1 or 2 pts. I'll let everyone know of the change when it happens. When I info to the post, I'll separate them at the bottom with '---'.
Watch out for the NE NYJ game... NYJ to win at 67%. I simulated twice to be sure. The numbers make sense, but Brady is a wild card.
---
The rest of the stats will be up a little later, Friday at the very latest.
---
Most of the stats are up.
CLE at DEN
Check out the Denver game! I don't think I've ever seen such a mismatch. DEN averaging 26 and CLE averaging 11 points. This is the first 70+% straight up game of the season... it's the first 80+%, too. Their passing games are pretty even. It looks like it really came down to the run game. Oddly enough, they perfectly matched each other in rush yds and carries, but on average, DEN scored 1 more rushing TD than CLE. 1.5 to 0.6. Sounds like red zone efficiency to me. Watch Buckhalter and Moreno destroy Cleveland's 32nd ranked run defense.
---
Alright, everything is up for the week. It looks like NFLSim went a little wild this weekend with its predictions. I'm going to chalk it up to the small amount of stats to work with. Then again, last week's predictions were a bit counter-intuitive and they worked out pretty nicely. Use these picks at your own discretion, don't rely on them for anything too important. Next week we'll be in business fo' sho'.
There's a 2nd 70+% straight up game: MIA over IND, who'da thunk it. In both passing and rushing, Miami was able to score more touchdowns.
Then again, there are some experts at ESPN and other sports news outlets that agree with some of the more eccentric picks...
Wednesday, September 9, 2009
Update 2
Black Box Sports is now Sim Capper.
All of the website urls (blackboxsports.blogspot.com, nflblackbox.blogspot.com, nbablackbox.blogspot.com) still work and will still take you where you want to go. But now the main Black Box Sports site can be accessed by the url www.simcapper.com.
The new email is simcapper@gmail.com.
Jonathan
The Sim Capper
Wednesday, September 2, 2009
Black Box Sports is now The Sim Capper
Congratulations Jeff P. The Sim Capper is the winner!
Runners up: Jared R. - Cognition Sports; Mike R. - Neural Net Bets
Thanks for all the great submissions, I appreciate your help!
The new website will be www.simcapper.com. Short and sweet. The website isn't set up yet, but expect its launch in a few days. Otherwise, everything will remain the same. Same great picks, same great rankings, same great content, awesome new name.
Any feedback?
Jonathan
The Sim Capper
Monday, August 10, 2009
Black Box Sports Name Change Contest (Win $50)
Hi all,
I think it may be time to move to a real website. Unfortunately, blackboxsports.com is already taken ... though they haven't updated their site in over a year (as far as I can tell) ... what a waste of a great name.
Remember, there are no plans to charge for the use of my Black Box Sports. NFL and NBA Black Box will remain totally free! I will always be available to answer your questions and I will try my damnedest to update the site every week in a timely fashion.
I'm asking you fine gents (any ladies out there?) to think of a new name for Black Box Sports. I'm one of the (un)lucky 80% of unemployed college grads, so I can't offer a huge prize to the winner. How does$20 $50 sound? $20 $50 goes to the winner of the Black Box Sports name change contest.
The goal is to think of an edgy name that (prefferably) alludes to computers/simulations and appeals to your demographic. When people hear your name, they're curious, they have to check out the site, and once they do, they're so intrigued by the idea of an accurate football simulation that they're back next week just to see how it did.
Submit your entry as a comment in this post or send it to blackboxsports@gmail.com. You can submit as many names as you want. The more names you submit, the better your chance to win. It's free to enter and you can win$20 $50. If you post it, please post using a Google or Aim account or with your email or something so I can contact you if you win. And be sure that "yourentry".com is available.
The Contest: Submit a new name for Black Box Sports
The Prize:$20 $50 via Paypal
The Deadline: Midnight of August 31, 2009
Announcement of the Winner: September 1, 2009
I think it may be time to move to a real website. Unfortunately, blackboxsports.com is already taken ... though they haven't updated their site in over a year (as far as I can tell) ... what a waste of a great name.
Remember, there are no plans to charge for the use of my Black Box Sports. NFL and NBA Black Box will remain totally free! I will always be available to answer your questions and I will try my damnedest to update the site every week in a timely fashion.
I'm asking you fine gents (any ladies out there?) to think of a new name for Black Box Sports. I'm one of the (un)lucky 80% of unemployed college grads, so I can't offer a huge prize to the winner. How does
The goal is to think of an edgy name that (prefferably) alludes to computers/simulations and appeals to your demographic. When people hear your name, they're curious, they have to check out the site, and once they do, they're so intrigued by the idea of an accurate football simulation that they're back next week just to see how it did.
Submit your entry as a comment in this post or send it to blackboxsports@gmail.com. You can submit as many names as you want. The more names you submit, the better your chance to win. It's free to enter and you can win
The Contest: Submit a new name for Black Box Sports
The Prize:
The Deadline: Midnight of August 31, 2009
Announcement of the Winner: September 1, 2009
Sunday, August 9, 2009
2008 Season Results
CHECK OUT THE POST ABOVE, BLACK BOX NAME CHANGE CONTEST (win $20 $50, free to enter, just submit a new name!)
These results from last year, excluding weeks 1 and 2, which there wasn't enough data for. It's broken into 3 sections: Straight up Winner, Against the Spread, and Over/Under. I broke down the approximately 200 games into 5 intervals, each interval representing a confidence spread of 10%. When you see 96 games in the 50-59% interval, that means of the 200+- games NFLSim picked, 96 games fell in the confidence interval of 50-59%. Likewise, 70 games had winners predicted as 60-69% favorites (in the straight-up category). To the left of the 'Games' column is the 'Correct' column. That is simply the number of NFLSim's correct picks in that interval. Accuracy is the percentage of time that NFLSim correctly picked a game in that interval.
1. Straight up Winner
NFLSim was absolutely phenomenal when it came to picking the winner. At first glance, you see the season record at 139-70 (66.5%). That's nothing special until you take a deeper look at the statistics.
First, lets take a look at the 'expected number of wins' for each interval. In the 50-59% interval, it can be expected that after a large number of games, 55% of those games should be picked correctly(the mid-point of the 50's). In the 60-69% interval, 65% should be picked correctly, and so on. The closer NFLSim's number of correct picks is to the expected number of correct picks, the better NFLSim approximates reality. This is very important, because if you know the exact probability of a team winning, you automatically know if Vegas' payout makes for a good bet or a bad bet. The closer that the predicted probability is to the actual probability, the smarter your bets are. The smarter your bets, the more $ you make! (This is the basis for the Bet Optimization Algorithm.... which is new and much improved this year.)
If we take a look at the first interval, 50-59%, 96 games took place. In theory, you should expect that 55% of those teams predicted to win should actually win. 55% of 96 games, 55% * 96, equals an expected number of wins of 53. NFLSim actually picked 61 winners, so it beat the expected number of wins by 8. This is great because it picked more winners than it was supposed to, but it was pretty far from the expected number of wins. From 60% on is where it gets very, very interesting. NFLSim reaches near theoretical perfection - the probability given by NFLSim is the actual probability that the team will win!!! If anyone has seen this feat achieved by anyone else please let me know.
Here is a table of expected numbers of wins:

In the graph: Red is what should have happened, Blue is what did happen.
Now that I've gone through the whole explanation of the stats, I'll skip straight to the numbers.
2. ATS
ATS didn't do as well as straight-up. Looks like it was pretty close to a flip of a coin. The right team would win by the wrong score. I would hate to tamper with the program when the straight-up accuracy is so reliable after 209 games. I'll probably just stop posting ATS until I can fix it up.
 Interestingly, the slope of the trend line is almost what it should be. Had 1 of the 80% games won, it would be almost perfect (albeit far lower than it should be). That suggests that all I may need to do is to add/subtract from the calculated probability to arrive at the true probability... interesting. There is back testing to be done!
3. Over/Under
Finally, if you haven't gone to sleep yet, here are the O/U stats. O/U actually did much better than I expected. It performed much better than the ATS and its accuracy approached the expected accuracy.
O/U actually performed very well compared to what was expected. And hell, at 56% accuracy, you'll be making money anyway.

You've seen the performance, you've seen the stats, you know what to expect. What it comes down to:
Everyone's a winner with Black Box Sports. (especially if you win$20 $50 in the name change contest)
CHECK OUT THE POST BELOW FOR THE NAME CHANGE CONTEST (win$20 $50 for sending in your best name)
Jonathan
Black Box Sports
These results from last year, excluding weeks 1 and 2, which there wasn't enough data for. It's broken into 3 sections: Straight up Winner, Against the Spread, and Over/Under. I broke down the approximately 200 games into 5 intervals, each interval representing a confidence spread of 10%. When you see 96 games in the 50-59% interval, that means of the 200+- games NFLSim picked, 96 games fell in the confidence interval of 50-59%. Likewise, 70 games had winners predicted as 60-69% favorites (in the straight-up category). To the left of the 'Games' column is the 'Correct' column. That is simply the number of NFLSim's correct picks in that interval. Accuracy is the percentage of time that NFLSim correctly picked a game in that interval.
1. Straight up Winner
NFLSim was absolutely phenomenal when it came to picking the winner. At first glance, you see the season record at 139-70 (66.5%). That's nothing special until you take a deeper look at the statistics.
| Straight-up | % Interval | Wins | Games | Win % |
| 50-59% | 61 | 96 | 63.5% | |
| 60-69 | 45 | 70 | 64.3 | |
| 70-79 | 27 | 36 | 75 | |
| 80-89 | 4 | 5 | 8 | |
| 90-100 | 2 | 2 | 1 | |
| Total | 139 | 209 | 66.5 |
First, lets take a look at the 'expected number of wins' for each interval. In the 50-59% interval, it can be expected that after a large number of games, 55% of those games should be picked correctly(the mid-point of the 50's). In the 60-69% interval, 65% should be picked correctly, and so on. The closer NFLSim's number of correct picks is to the expected number of correct picks, the better NFLSim approximates reality. This is very important, because if you know the exact probability of a team winning, you automatically know if Vegas' payout makes for a good bet or a bad bet. The closer that the predicted probability is to the actual probability, the smarter your bets are. The smarter your bets, the more $ you make! (This is the basis for the Bet Optimization Algorithm.... which is new and much improved this year.)
If we take a look at the first interval, 50-59%, 96 games took place. In theory, you should expect that 55% of those teams predicted to win should actually win. 55% of 96 games, 55% * 96, equals an expected number of wins of 53. NFLSim actually picked 61 winners, so it beat the expected number of wins by 8. This is great because it picked more winners than it was supposed to, but it was pretty far from the expected number of wins. From 60% on is where it gets very, very interesting. NFLSim reaches near theoretical perfection - the probability given by NFLSim is the actual probability that the team will win!!! If anyone has seen this feat achieved by anyone else please let me know.
Here is a table of expected numbers of wins:
| | Expected Correct | Actual Correct |
| 50-59% | 53 | 61 |
| 60-69 | 46 | 45 |
| 70-79 | 27 | 27 |
| 80-89 | 4 | 4 |
| 90-100 | 2 | 2 |
| Total | 132 | 139 |

In the graph: Red is what should have happened, Blue is what did happen.
Now that I've gone through the whole explanation of the stats, I'll skip straight to the numbers.
2. ATS
ATS didn't do as well as straight-up. Looks like it was pretty close to a flip of a coin. The right team would win by the wrong score. I would hate to tamper with the program when the straight-up accuracy is so reliable after 209 games. I'll probably just stop posting ATS until I can fix it up.
| ATS | % Interval | Wins | Games | Win % |
| 50-59 | 37 | 86 | 43 | |
| 60-69 | 46 | 78 | 59 | |
| 70-79 | 18 | 33 | 54.5 | |
| 80-89 | 0 | 3 | 0 | |
| 90-100 | 1 | 1 | 100 | |
| Total | 102 | 201 | 50.7 |
| | Exp. Correct | Actual Correct |
| 50-59% | 47 | 37 |
| 60-69 | 51 | 46 |
| 70-79 | 25 | 18 |
| 80-89 | 3 | 0 |
| 90-100 | 1 | 1 |
| Total | 127 | 102 |
 Interestingly, the slope of the trend line is almost what it should be. Had 1 of the 80% games won, it would be almost perfect (albeit far lower than it should be). That suggests that all I may need to do is to add/subtract from the calculated probability to arrive at the true probability... interesting. There is back testing to be done!
3. Over/Under
Finally, if you haven't gone to sleep yet, here are the O/U stats. O/U actually did much better than I expected. It performed much better than the ATS and its accuracy approached the expected accuracy.
| Over/Under | % Interval | Wins | Games | O/U Win % |
| 50-59 | 77 | 145 | 53.1 | |
| 60-69 | 30 | 48 | 62.5 | |
| 70-79 | 3 | 6 | 50 | |
| 80-89 | 2 | 3 | 66.7 | |
| 90-100 | 2 | 2 | 100 | |
| Total | 114 | 204 | 55.9 |
| | Exp. Correct | Actual Correct |
| 50-59% | 80 | 77 |
| 60-69 | 31 | 30 |
| 70-79 | 5 | 3 |
| 80-89 | 3 | 2 |
| 90-100 | 2 | 2 |
| Total | 121 | 114 |
O/U actually performed very well compared to what was expected. And hell, at 56% accuracy, you'll be making money anyway.

You've seen the performance, you've seen the stats, you know what to expect. What it comes down to:
Everyone's a winner with Black Box Sports. (especially if you win
CHECK OUT THE POST BELOW FOR THE NAME CHANGE CONTEST (win
Jonathan
Black Box Sports
Monday, November 17, 2008
NFLSim Stats vs. Actual NFL Stats
I'm sure everyone's curious to see how NFLSim actually compares to real life. These are the overall results so far. First, I'll post the comparison of NFLSim averages to NFL averages. Later, I'll post a team-by-team comparison to see how well it works on a smaller scale. I'm only going to focus on the main stats: passing, rushing, and game stats. I'll put up my average alongside the real stats. When you average the stats from all of the teams, the total offensive averages are the same as the defensive averages.
Many stats are very close to reality, some aren't as close. I know many of you out there are interested in sports statistics and many are interested in fantasy football, so this is for you guys. NFLSim is good, but it's not perfect. This is an opportunity for everyone to get a better understanding of what it does as well as for myself to make improvements.
I encourage everyone to email other NFL simulators to find out how they're doing, then post that over here for a comparison. If you're going to be following their models, you should know how those models actually perform.
These numbers tell me that for the most part, everything is going very well. Some changes I need to make include: more passes, decrease the average rush yards, decrease fumble %, and adjust 3rd down play selection. No major changes, just little tweaks. Otherwise, things are going swimmingly. Send me some feedback, I'd like to hear what everyone thinks.
| PASSING | ||
| ATT/GAME | NFLSim | NFL |
| Average | 27.2 | 32.4 |
| COMP/G | ||
| Average | 17.0 | 19.8 |
| COMP % | ||
| Average | 62.3% | 61.3% |
| YDS/G | ||
| Average | 192.2 | 212.9 |
| YDS/PASS | ||
| Average | 7.06 | 6.97 |
| PASS TD/G | ||
| Average | 1.60 | 1.30 |
| INT/G | ||
| Average | 0.79 | 0.90 |
| SACK/G | ||
| Average | 2.1 | 2.1 |
| QB RATING | ||
| Average | 91.0 | 83.6 |
| RUSHING | ||
| ATT/GAME | NFLSim | NFL |
| Average | 27.6 | 27.3 |
| YDS/G | ||
| Average | 118.4 | 112.3 |
| YDS/RUSH | ||
| Average | 4.3 | 4.1 |
| RUSH TD/G | ||
| Average | 1.2 | 0.9 |
| FUM/G | ||
| Average | 0.6 | 0.4 |
| GAME STATS | ||
| PTS/G | NFLSim | NFL |
| Average | 22.9 | 22.2 |
| PLAYS/G | ||
| Average | 60.3 | 61.8 |
| TOTAL YDS/G | ||
| Average | 310.6 | 325.2 |
| YDS/PLAY | ||
| Average | 5.2 | 5.3 |
| 3rd DN % | ||
| Average | 25.8% | 39.4% |
| YDS/PT | ||
| Average | 13.6 | 14.9 |
Saturday, November 15, 2008
Week 11: Stats
| Week 11 | YDS/PASS | YDS/PLAY | YDS/PT | QB RATING |
| Arizona Cardinals | 8.22 | 5.52 | 13.70 | 108.29 |
| Atlanta Falcons | 7.93 | 5.92 | 14.61 | 105.39 |
| Baltimore Ravens | 6.50 | 4.44 | 14.86 | 82.55 |
| Buffalo Bills | 8.03 | 5.60 | 12.55 | 99.65 |
| Carolina Panthers | 8.24 | 5.69 | 13.04 | 104.08 |
| Chicago Bears | 5.06 | 4.07 | 12.73 | 64.71 |
| Cincinnati Bengals | 6.17 | 4.45 | 16.77 | 73.28 |
| Cleveland Browns | 6.20 | 4.53 | 15.03 | 83.65 |
| Dallas Cowboys | 6.45 | 4.60 | 16.68 | 81.16 |
| Denver Broncos | 6.76 | 5.17 | 14.54 | 86.81 |
| Detroit Lions | 5.72 | 4.30 | 16.50 | 74.13 |
| Green Bay Packers | 7.25 | 4.97 | 13.48 | 94.74 |
| Houston Texans | 5.86 | 4.54 | 14.02 | 78.42 |
| Indianapolis Colts | 7.94 | 5.60 | 13.70 | 98.65 |
| Jacksonville Jaguars | 6.97 | 4.94 | 14.82 | 88.92 |
| Kansas City Chiefs | 6.67 | 5.11 | 13.90 | 86.81 |
| Miami Dolphins | 7.49 | 5.42 | 13.22 | 94.58 |
| Minnesota Vikings | 6.16 | 4.62 | 15.26 | 76.51 |
| New England Patriots | 7.15 | 4.92 | 12.35 | 98.34 |
| New Orleans Saints | 8.01 | 5.76 | 14.63 | 101.83 |
| New York Giants | 6.52 | 5.00 | 14.33 | 81.69 |
| New York Jets | 7.34 | 5.40 | 15.38 | 87.26 |
| Oakland Raiders | 6.27 | 4.48 | 17.35 | 77.90 |
| Philadelphia Eagles | 6.70 | 4.95 | 12.76 | 96.44 |
| Pittsburgh Steelers | 7.41 | 4.86 | 13.89 | 95.48 |
| San Diego Chargers | 6.95 | 4.53 | 13.89 | 91.91 |
| San Francisco 49ers | 6.80 | 5.20 | 15.93 | 83.15 |
| Seattle Seahawks | 6.40 | 4.88 | 13.35 | 83.52 |
| St. Louis Rams | 5.82 | 4.31 | 14.39 | 76.82 |
| Tampa Bay Buccaneers | 7.04 | 5.09 | 15.14 | 93.85 |
| Tennessee Titans | 6.50 | 4.77 | 13.70 | 87.08 |
| Washington Redskins | 7.25 | 5.42 | 12.59 | 101.63 |
| Average | 6.87 | 4.97 | 14.35 | 88.73 |
Thursday, November 6, 2008
Week 10: Predictions
Ok, here's the new format. Same thing as before, but no I add the average scores as well. Underneath the matchup are the average scores. DEN's average score over the course of 500 simulations was 21.25 and CLE's average score was 21.40. Average scores aren't predictions of the score, they're just measures of relative performance. Every once in a while, one team will be favored to win even though on average they score less. This is the case with the DEN game. I wish there was an easier way to cram more stats into each game, but this blog format is really limiting.
I'm also planning on posting games as I finish them. One last change, instead of reposting everything an a "Results" section, i'm going to color everything in the "Prediction" section. A small "Results" section will sum up the weekend.
Only 2 upsets this week, DEN over CLE (52%) and HOU over BAL (57%). More 'UNDER's than usual. More favorites covering the spread, as well.
DEN at CLE -3.5, 45.5
DEN: 21.25
CLE: 21.40
Winner: DEN, 52%
Spread: DEN +3.5, 60%
O/U: UNDER, 61%
BAL -1 at HOU, 42
BAL: 21.57
HOU: 23.12
Winner: HOU, 57%
Spread: HOU +1, 59%
O/U: OVER, 55%
BUF at NE -3.5, 41.5
BUF: 22.10
NE: 23.41
Winner: NE, 55%
Spread: BUF +3.5, 54%
O/U: OVER, 59%
GB at MIN -2, 45.5
GB: 19.95
MIN: 23.45
Winner: MIN, 57%
Spread: MIN -2, 54%
O/U: UNDER, 59%
JAX -6.5 at DET, 44.5
JAX: 24.65
DET: 22.00
Winner: JAX, 56%
Spread: DET +6.5, 64%
O/U: OVER, 56%
NO at ATL -1, 50
NO: 22.22
ATL: 26.39
Winner: ATL, 59%
Spread: ATL -1, 58%
O/U: UNDER, 57%
SEA at MIA -8.5, 43
SEA: 17.19
MIA: 29.42
Winner: MIA, 79%
Spread: MIA -8.5, 54%
O/U: OVER, 59%
STL at NYJ -8.5, 44
STL: 19.05
NYJ: 27.06
Winner: NYJ, 70%
Spread: STL +8.5, 51%
O/U: OVER, 53%
TEN -3 at CHI, 38.5
TEN: 22.33
CHI: 18.47
Winner: TEN, 60%
Spread: CHI +3, 51%
O/U: OVER, 52%
CAR -9.5 at OAK, 37.5
CAR: 21.15
OAK: 19.93
Winner: CAR, 54%
Spread: OAK +9.5, 72%
O/U: OVER, 58%
IND at PIT -3.5, 39.5
IND: 17.97
PIT: 22.27
Winner: PIT, 62%
Spread: PIT -3.5, 54%
O/U: UNDER, 51%
KC at SD -15, 47
KC: 18.93
SD: 26.02
Winner: SD, 70%
Spread: KC +15, 74%
O/U: UNDER, 60%
NYG at PHI -3, 43.5
NYG: 18.88
PHI: 25.48
Winner: PHI, 65%
Spread: PHI -3, 58%
O/U: OVER, 52%
SF at ARI -9.5, 45.5
SF: 20.34
ARI: 24.25
Winner: ARI, 63%
Spread: SF +9.5, 70%
O/U: UNDER, 57%
Wednesday, November 5, 2008
Midseason Progressive Results
And now, what everyone's been waiting for. We're about halfway through the season, so I think it's time to post NFLSim's impressive progressive results. I chose to leave out week 2 because It was still too early for me to be making predictions based on 1 week of data. I'm going to post Accuscore's results as well for a comparison. They're the only other play-by-play NFL simulator I know of and they're a well established, well funded, syndicated, sponsored, and mathematically sophisticated operation. David and Goliath? Let's see...
I'm going to give you several different numbers. First, I'll give you the overall numbers, as in the collective 50-100% predictions for winner, spread, and o/u. Then you'll get their numbers broken down. I'll show you weekly trends, % trends, etc.
Overall numbers:
Winner: 65-34 (65.7%)
Spread: 47-45 (51.5%)
O/U: 50-43 (53.8%)
Spread and O/U combined: 97-88 (53.8%)
Accuscore numbers:
Winner: 87-43 (66.9%)
Spread: 51-50 (50.5%)
O/U: 67-50 (57.2%)
Spread and O/U combined: 118-100 (54.1%)
Accuscore has a slight edge when picking the winner, I have a slight edge picking ATS, and Accuscore has a sizeable advantage picking O/U. BUT! Let's look at how Black Box Sports picks compare when confidence is at least 60%. This confidence is really where NFLSim shines. Here is Black Box Sports's record when the confidence is over 60% compared to Accuscore's overall record (can't find any confidence values for picks). Fasten your seat belts.
Black Box Sports +60%:
Winner: 41-19 (68.3%) ... 22-8 (73.3%) when greater than 70%
Spread: 36-21 (63.2%)
O/U: 21-10 (67.7%)
Spread and O/U: 57-31 (64.7%)
Betting 100 units on the spread and over/under, you made +2290, ROI of 26%, halfway through the season.
Once again, Accuscore's numbers:
Accuscore:
Winner: 87-43 (66.9%)
Spread: 51-50 (50.5%)
O/U: 67-50 (57.2%)
Spread and O/U combined: 118-100 (54.1%)
Picking the winner, I'm ahead by 1.4% when at least 60% confidence, 6.4% when at least 70% confidence. Spread, I'm ahead by 12.7%. O/U, up by 10.5%. Combined, I'm up by 10.6%. That's what I'm talking about. Not to mention I offer all the picks for free... Spread the word everyone.
In tabular format:
Graphically:
Theoretically, as in, if NFLSim was a perfect analog of reality, those dashed lines would be perfectly in line with the thick black line. It would mean that the confidence values are always spot on and the games end exactly the way they should. If the trend (dashed) lines are below the thick line, the confidence values are not as accurate as reality. The more parallel the thick and trend lines are, the more accurate the changes in confidenc values are, i.e., as confidence increases, the accuracy increases at the correct rate. If that makes any sense. This graph shows all the picks.
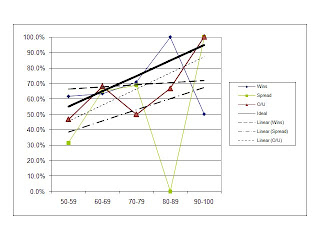
You'll notice that above, the win % for 90-100 is at 50%. In week 3, the 90.03% favorite NE lost to MIA. 0.03% is just about a difference of 1 game in the entire set of hundreds and hundreds of simulated games. Had NE been an 89.97% favorite, the graph would look like this:
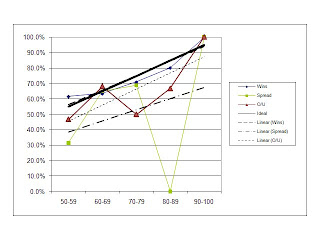
Check out the 'Wins' line. The Wins line overlaps the theoretical line. You can't even see it. That's absolutely absurd, especially after 100 games. The trendline has a slope of .09, compared to the theoretical line's .1. The "Wins" trendline has an R-squared value (a measure of how closely the data points fit the line) of 0.89. Absolutely insane. In general, I try to temper my enthusiasm, but this is unbelievable... This means that when NFLSim says a team will win 63% of the time, that team will win 63% of the time. For those of you math-minded people, the expected number of wins is approximately 64.15. The actual number of wins is 65. That blows my mind.
Here's a team-by-team accuracy breakdown:
I'll post some more stats if I have a chance.
Enjoy!
I'd love to hear everyone's reactions and questions, so don't be shy, send me some emails.
I'm going to give you several different numbers. First, I'll give you the overall numbers, as in the collective 50-100% predictions for winner, spread, and o/u. Then you'll get their numbers broken down. I'll show you weekly trends, % trends, etc.
Overall numbers:
Winner: 65-34 (65.7%)
Spread: 47-45 (51.5%)
O/U: 50-43 (53.8%)
Spread and O/U combined: 97-88 (53.8%)
Accuscore numbers:
Winner: 87-43 (66.9%)
Spread: 51-50 (50.5%)
O/U: 67-50 (57.2%)
Spread and O/U combined: 118-100 (54.1%)
Accuscore has a slight edge when picking the winner, I have a slight edge picking ATS, and Accuscore has a sizeable advantage picking O/U. BUT! Let's look at how Black Box Sports picks compare when confidence is at least 60%. This confidence is really where NFLSim shines. Here is Black Box Sports's record when the confidence is over 60% compared to Accuscore's overall record (can't find any confidence values for picks). Fasten your seat belts.
Black Box Sports +60%:
Winner: 41-19 (68.3%) ... 22-8 (73.3%) when greater than 70%
Spread: 36-21 (63.2%)
O/U: 21-10 (67.7%)
Spread and O/U: 57-31 (64.7%)
Betting 100 units on the spread and over/under, you made +2290, ROI of 26%, halfway through the season.
Once again, Accuscore's numbers:
Accuscore:
Winner: 87-43 (66.9%)
Spread: 51-50 (50.5%)
O/U: 67-50 (57.2%)
Spread and O/U combined: 118-100 (54.1%)
Picking the winner, I'm ahead by 1.4% when at least 60% confidence, 6.4% when at least 70% confidence. Spread, I'm ahead by 12.7%. O/U, up by 10.5%. Combined, I'm up by 10.6%. That's what I'm talking about. Not to mention I offer all the picks for free... Spread the word everyone.
In tabular format:
| Winner | Wins | Games | Win % | |
| 50-59 | 24 | 39 | 61.5% | |
| 60-69 | 19 | 30 | 63.3% | |
| 70-79 | 17 | 24 | 70.8% | |
| 80-89 | 4 | 4 | 100.0% | |
| 90-100 | 1 | 2 | 50.0% | |
| Total | 65 | 99 | 65.7% | |
| Spread | Wins | Games | Win % | |
| 50-59 | 11 | 35 | 31.4% | |
| 60-69 | 24 | 37 | 64.9% | |
| 70-79 | 11 | 16 | 68.8% | |
| 80-89 | 0 | 3 | 0.0% | |
| 90-100 | 1 | 1 | 100.0% | |
| Total | 47 | 92 | 51.1% | |
| Over | Wins | Games | Win % | |
| 50-59 | 29 | 62 | 46.8% | |
| 60-69 | 15 | 22 | 68.2% | |
| 70-79 | 2 | 4 | 50.0% | |
| 80-89 | 2 | 3 | 66.7% | |
| 90-100 | 2 | 2 | 100.0% | |
| Total | 50 | 93 | 53.8% |
S&O/U | ||||
| 50-59 | 40 | 97 | 41.2% | |
| 60-69 | 39 | 59 | 66.1% | |
| 70-79 | 13 | 20 | 65.0% | |
| 80-89 | 2 | 6 | 33.3% | |
| 90-100 | 3 | 3 | 100.0% | |
| Total | 97 | 185 | 52.4% |
Graphically:
Theoretically, as in, if NFLSim was a perfect analog of reality, those dashed lines would be perfectly in line with the thick black line. It would mean that the confidence values are always spot on and the games end exactly the way they should. If the trend (dashed) lines are below the thick line, the confidence values are not as accurate as reality. The more parallel the thick and trend lines are, the more accurate the changes in confidenc values are, i.e., as confidence increases, the accuracy increases at the correct rate. If that makes any sense. This graph shows all the picks.

You'll notice that above, the win % for 90-100 is at 50%. In week 3, the 90.03% favorite NE lost to MIA. 0.03% is just about a difference of 1 game in the entire set of hundreds and hundreds of simulated games. Had NE been an 89.97% favorite, the graph would look like this:

Check out the 'Wins' line. The Wins line overlaps the theoretical line. You can't even see it. That's absolutely absurd, especially after 100 games. The trendline has a slope of .09, compared to the theoretical line's .1. The "Wins" trendline has an R-squared value (a measure of how closely the data points fit the line) of 0.89. Absolutely insane. In general, I try to temper my enthusiasm, but this is unbelievable... This means that when NFLSim says a team will win 63% of the time, that team will win 63% of the time. For those of you math-minded people, the expected number of wins is approximately 64.15. The actual number of wins is 65. That blows my mind.
Here's a team-by-team accuracy breakdown:
| Win % | Cover Spread % | Over % | |
| ARI | 83.3% | 40.0% | 50.0% |
| ATL | 66.7% | 50.0% | 33.3% |
| BAL | 57.1% | 42.9% | 71.4% |
| BUF | 66.7% | 50.0% | 66.7% |
| CAR | 83.3% | 40.0% | 50.0% |
| CHI | 50.0% | 50.0% | 66.7% |
| CIN | 71.4% | 71.4% | 33.3% |
| CLE | 42.9% | 42.9% | 57.1% |
| DAL | 57.1% | 57.1% | 57.1% |
| DEN | 50.0% | 33.3% | 20.0% |
| DET | 100.0% | 66.7% | 40.0% |
| GB | 100.0% | 66.7% | 66.7% |
| HOU | 71.4% | 57.1% | 85.7% |
| IND | 33.3% | 50.0% | 33.3% |
| JAX | 33.3% | 66.7% | 60.0% |
| KC | 83.3% | 66.7% | 83.3% |
| MIA | 33.3% | 66.7% | 50.0% |
| MIN | 83.3% | 66.7% | 50.0% |
| NE | 33.3% | 20.0% | 20.0% |
| NO | 66.7% | 33.3% | 50.0% |
| NYG | 66.7% | 16.7% | 20.0% |
| NYJ | 71.4% | 57.1% | 57.1% |
| OAK | 57.1% | 14.3% | 57.1% |
| PHI | 66.7% | 0.0% | 66.7% |
| PIT | 50.0% | 66.7% | 66.7% |
| SD | 83.3% | 50.0% | 33.3% |
| SEA | 83.3% | 50.0% | 33.3% |
| SF | 50.0% | 33.3% | 40.0% |
| STL | 57.1% | 50.0% | 28.6% |
| TB | 71.4% | 42.9% | 57.1% |
| TEN | 100.0% | 66.7% | 83.3% |
| WAS | 42.9% | 28.6% | 33.3% |
I'll post some more stats if I have a chance.
Enjoy!
I'd love to hear everyone's reactions and questions, so don't be shy, send me some emails.
Friday, October 31, 2008
Week 9: Predictions
ARI -3 at STL, 48
Winner: ARI, 51%
Spread: STL +3, 61%
O/U: OVER, 54%
BAL at CLE -1.5, 36.5
Winner: BAL, 59%
Spread: BAL +1.5, 61%
O/U: OVER, 53%
DET at CHI -13, 43
Winner: CHI, 79%
Spread: DET +13, 64%
O/U: OVER, 61%
GB at TEN -5.5, 41.5
Winner: TEN, 64%
Spread: GB +5.5, 53%
O/U: UNDER, 51%
HOU at MIN -4.5, 47
Winner: MIN, 51%
Spread: HOU +4.5, 62%
O/U: OVER, 52%
JAX -7.5 at CIN, 40
Winner: JAX, 59%
Spread: CIN +7.5, 64%
O/U: OVER, 61%
NYJ at BUF -5.5, 42
Winner: BUF, 66%
Spread: BUF -5.5, 54%
O/U: OVER, 55%
TB -9 at KC, 36.5
Winner: TB, 60%
Spread: KC +9, 68%
O/U: OVER, 68%
MIA at DEN -3.5, 49
Winner: MIA, 56%
Spread: MIA +3.5, 72%
O/U: OVER, 55%
ATL -3 at OAK, 41
Winner: OAK, 54%
Spread: OAK +3, 65%
O/U: OVER, 61%
DAL at NYG -9, 41
Winner: NYG, 79%
Spread: DAL +9, 54%
O/U: UNDER, 58%
PHI -7 at SEA, 43
Winner: PHI, 76%
Spread: SEA +7, 52%
O/U: OVER, 60%
NE at IND -6, 44
Winner: NE, 57%
Spread: NE +6, 74%
O/U: OVER, 58%
PIT at WAS -1.5, 37
Winner: WAS, 67%
Spread: WAS -1.5, 65%
O/U: OVER, 54%
Subscribe to:
Posts (Atom)
